

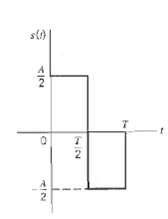
Question: Consider the signal s (t) shown in Figure. (a) Determine the impulse response of a filter matched to this signal and sketch it as a
Consider the signal s (t) shown in Figure.
(a) Determine the impulse response of a filter matched to this signal and sketch it as a function of rime.
(b) Plot the matched filter output as a function of time.
(c) What is the peak value of the output?
sto |
Step by Step Solution
★★★★★
3.39 Rating (158 Votes )
There are 3 Steps involved in it
1 Expert Approved Answer
Step: 1 Unlock

a The impulse response of the matched filter is ht sTt The st an... View full answer
Question Has Been Solved by an Expert!
Get step-by-step solutions from verified subject matter experts
Step: 2 Unlock
Step: 3 Unlock
Document Format (1 attachment)
19-E-T-E-C-S (285).docx
120 KBs Word File