

Question: High-low method and regression analysis. Happy Business College has recently opened a restaurant as part of its hospitality major. For the first 10 weeks the
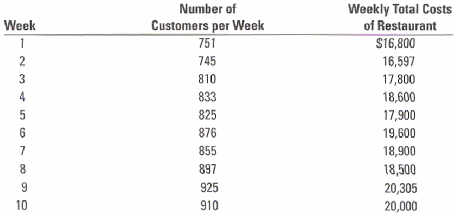
High-low method and regression analysis. Happy Business College has recently opened a restaurant as part of its hospitality major. For the first 10 weeks the manager did not estimate any costs, but instead hoped revenues would cover costs. One of the new waiters, who happens to be taking a cost accounting class, suggests that the manager take the past known weekly costs and try to determine a cost equation by relating the cost to the number of customers served. The cost and customer data are as follows:
The manager gives this information to the waiter, who runs a regression and gets the following equation:
Weekly total restaurant costs = $2,453 + ($19.04 × Number of customers per week)
1. Plot the relationship between number of customers per week and weekly total restaurant costs.
2. Estimate the cost equation using the high-low method, and draw this line on your graph.
3. Draw the regression line on your graph. Use your graph to evaluate the regression line using the criteria of economic plausibility, goodness of fit, and significance of the independent variable. Is the cost function estimated using the high-low method a close approximation to the cost function estimated using the regression method. Explain briefly.
4. At what point (number of customers) will the expected total cost based on the high-low equation equal the expected total cost based on the regression equation?
Weekly Total Costs of Restaurant Number of Week Customers per Week 751 S16,800 745 16,597 3 810 17,800 4 833 18,600 825 17,900 876 19,600 18,900 855 897 18,500 20,305 20,000 925 10 910
Step by Step Solution
3.25 Rating (166 Votes )
There are 3 Steps involved in it
Highlow method and regression analysis 1 Solution Exhibit 1032 SOLUTION EXHIBIT 1032 Plot Highlow Line and Regression Line for Number of Customers per ... View full answer

Get step-by-step solutions from verified subject matter experts
Document Format (1 attachment)
24-B-C-A-C-B-M (47).docx
120 KBs Word File