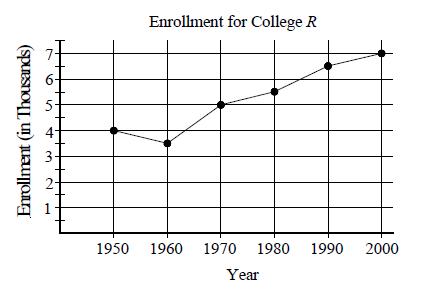
The line graph shows the enrollment for College R between 1950 and 2000. According to the graph
Question:
The line graph shows the enrollment for College R between 1950 and 2000.
According to the graph above, College R showed the greatest change in enrollment between which two decades?
A) 1950 to 1960
B) 1960 to 1970
C) 1970 to 1980
D) 1980 to 1990
Transcribed Image Text:
Enrollment (in Thousands) 4 5 M 1950 Enrollment for College R 1960 1970 1980 1990 2000 Year
Fantastic news! We've Found the answer you've been seeking!
Step by Step Answer:
Answer rating: 33% (6 reviews)
B Enrollment in Th...View the full answer

Answered By

Ashington Waweru
I am a lecturer, research writer and also a qualified financial analyst and accountant. I am qualified and articulate in many disciplines including English, Accounting, Finance, Quantitative spreadsheet analysis, Economics, and Statistics. I am an expert with sixteen years of experience in online industry-related work. I have a master's in business administration and a bachelor’s degree in education, accounting, and economics options.
I am a writer and proofreading expert with sixteen years of experience in online writing, proofreading, and text editing. I have vast knowledge and experience in writing techniques and styles such as APA, ASA, MLA, Chicago, Turabian, IEEE, and many others.
I am also an online blogger and research writer with sixteen years of writing and proofreading articles and reports. I have written many scripts and articles for blogs, and I also specialize in search engine
I have sixteen years of experience in Excel data entry, Excel data analysis, R-studio quantitative analysis, SPSS quantitative analysis, research writing, and proofreading articles and reports. I will deliver the highest quality online and offline Excel, R, SPSS, and other spreadsheet solutions within your operational deadlines. I have also compiled many original Excel quantitative and text spreadsheets which solve client’s problems in my research writing career.
I have extensive enterprise resource planning accounting, financial modeling, financial reporting, and company analysis: customer relationship management, enterprise resource planning, financial accounting projects, and corporate finance.
I am articulate in psychology, engineering, nursing, counseling, project management, accounting, finance, quantitative spreadsheet analysis, statistical and economic analysis, among many other industry fields and academic disciplines. I work to solve problems and provide accurate and credible solutions and research reports in all industries in the global economy.
I have taught and conducted masters and Ph.D. thesis research for specialists in Quantitative finance, Financial Accounting, Actuarial science, Macroeconomics, Microeconomics, Risk Management, Managerial Economics, Engineering Economics, Financial economics, Taxation and many other disciplines including water engineering, psychology, e-commerce, mechanical engineering, leadership and many others.
I have developed many courses on online websites like Teachable and Thinkific. I also developed an accounting reporting automation software project for Utafiti sacco located at ILRI Uthiru Kenya when I was working there in year 2001.
I am a mature, self-motivated worker who delivers high-quality, on-time reports which solve client’s problems accurately.
I have written many academic and professional industry research papers and tutored many clients from college to university undergraduate, master's and Ph.D. students, and corporate professionals. I anticipate your hiring me.
I know I will deliver the highest quality work you will find anywhere to award me your project work. Please note that I am looking for a long-term work relationship with you. I look forward to you delivering the best service to you.
3.00+
2+ Reviews
10+ Question Solved
Related Book For 

Question Posted:
Students also viewed these Mathematics questions
-
The line graph shows the enrollment for College R between 1950 and 2000. If enrollment increases by approximately the same percentage between 2000 and 2010 as it decreased between 1950 and 1960, what...
-
The line graph shows the enrollment for College R between 1950 and 2000. What is the average rate of increase in enrollment per decade between 1950 and 2000? A) 500 B) 600 C) 750 D) 875 Enrollment...
-
The table shows the life expectancies of a child (at birth) in the United States for selected years from 1940 through 2010. (Source: U.S. National Center for Health Statistics) A model for the life...
-
Suppose that we have a linear program that is not in standard form. We could produce the dual by first converting it to standard form, and then taking the dual. It would be more convenient, however,...
-
The net income (after income tax) of McCants Inc. was $2 per common share in the latest year and $6 per common share for the preceding year. At the beginning of the latest year, the number of shares...
-
For the gear trains sketched in the given figures, compute the output speed and the direction of rotation of the output shaft if the input shaft rotates at 1750 rpm clockwise. Use Figure P837. Input...
-
3. MarineCo has no debt but does have unfunded pension liabilities valued at $200 million, recorded as a long-term other liability. MarineCo has detailed in its annual report a potential legal...
-
Accountants for Johnson, Inc. have assembled the following data for the year ended December 31, 2015: Prepare Johnsons statement of cash flows using the indirect method. Include an accompanying...
-
4 i Saved Help Save Fun the banks in the following separate income statements a through e. Amounts to be deducted should by a minus sign.) d $ 68,000 b $ 43,600 $ c 56,000 e 25,500 los 16,950 6,500...
-
The figure shows a normal distribution with mean m and standard deviation d, including approximate percentages of the distribution corresponding to the regions shown. Suppose the SAT math scores of...
-
The test scores of 8 students are shown in the table. Let m be the mean of the scores and M be the median of the score. What is the value of Mm? A) 6 B) 0 C) 3 D) 6 Test Scores Number of Students 67...
-
Do you agree that contracts should be interpreted based on an objective assessment of the parties intentions? What would be the advantages and disadvantages of interpreting contracts based on...
-
Jason is a sole trader in the architecture industry. For the year ending 30 June 2019, Jason hired a 3D model designer, Sarah, to help him with the growing business. At the end of the year he has the...
-
Read Case 14-1 Trojan Technologies (15th ed., p. 426 OR 16th ed., p. 431) Guiding Questions and additional information: In preparing your case study, ensure that you answer the following questions:...
-
Jorge Rimert works for Road to Success Collection Agency. He oversees mailing out collection notices to patients. Upon review of the patients who have not paid from Hideaway Hospital, Jorge notices...
-
An epidemiologist plans to conduct a survey to estimate the percentage of women who give birth. How many women must be surveyed in order to be 99% confident that the estimated percentage is in error...
-
A 100 acre plot of land has a concentration time of 80 minutes. The area is residential single family homes with a C-0.40. What is the percent Increase in stormwater runoff from a 50 year recurrence...
-
Hatch plc has two classes of share capital outstanding: 8%, 20 par preference and 5 par ordinary. At December 31, 2018, the following accounts were included in equity. Share Capital-Preference,...
-
Show that the block upper triangular matrix A in Example 5 is invertible if and only if both A 11 and A 22 are invertible. Data from in Example 5 EXAMPLE 5 A matrix of the form A = [ A11 A12 0 A22 is...
-
Suppose 10% of the women assigned to the alendronate 5-mg group are actually not taking their pills (noncompliers). If noncompliers are assumed to have a similar response as women in the placebo...
-
What percentage of women in the alendronate 5-mg group can be expected to have a clinically significant decline in bone-mineral density as defined in Problem 5.68? The change in bone-mineral density...
-
If a decline of 2% in bone-mineral density is considered clinically significant, then what percentage of women in the placebo group can be expected to show a decline of at least this much?...
-
Question 4. - Week 9. What are the major competitive issues General Electric faces when managing cooperative strategies? - (7 marks)
-
All of the following are roles of a derivative exchange EXCEPT: _____. A) maintaining margin requirements on futures contracts B) reducing the default risk on forward contracts C) performing daily...
-
you are analyzing the cost of debt for a firm. Do you know that the firms 14 year maturity, 7.8 Percent coupon bonds are selling at a price of $834. The Barnes pay interest semi annually. If these...

Study smarter with the SolutionInn App


