

Question: An article in Fuel Processing Technology (Application of the Factorial Design of Experiments to Biodiesel Production from Lard, 2009, Vol. 90, pp. 14471451) described an
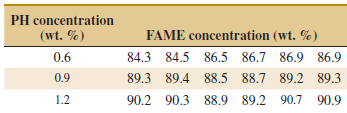
An article in Fuel Processing Technology (“Application of the Factorial Design of Experiments to Biodiesel Production from Lard,” 2009, Vol. 90, pp. 1447–1451) described an experiment to investigate the effect of potassium hydroxide in synthesis of biodiesel. It is suspected that potassium hydroxide (PH) is related to fatty acid methyl esters (FAME) which are key elements in biodiesel. Three levels of PH concentration were used, and six replicates were run in a random order. Data are shown in the following table.
(a) Construct box plots to compare the factor levels.
(b) Construct the analysis of variance. Are there any differences in PH concentrations at α = 0.05? Calculate the P-value.
(c) Analyze the residuals from the experiment.
(d) Plot average FAME against PH concentration and interpret your results.
(e) Compute a 95% confidence interval on mean FAME when the PH concentration is 1.2.
For each of the following parts, use the previous data to complete these parts.
(a) Apply Fisher’s LSD method with α = 0.05 and determine which levels of the factor differ.
(b) Use the graphical method to compare means described in this section and compare your conclusions to those from Fisher’s LSD method.
Step by Step Solution
There are 3 Steps involved in it
a b Anova Sector Factor Summary There are significant differences between the groups The Pvalu... View full answer

Get step-by-step solutions from verified subject matter experts