

Study the following table of figures and then answer the questions that follow. (a) Analyse the data
Question:
Study the following table of figures and then answer the questions that follow.
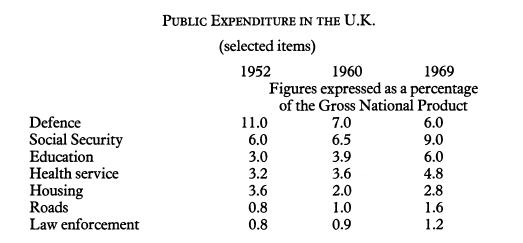
(a) Analyse the data given in the table under the title 'Changes in Public Expenditure in the U.K., 1952-1969'.
(b) Present the data given as a statistical diagram. Use any method you consider appropriate.
Fantastic news! We've Found the answer you've been seeking!
Step by Step Answer:

Answered By
Charles mwangi
I am a postgraduate in chemistry (Industrial chemistry with management),with writing experience for more than 3 years.I have specialized in content development,questions,term papers and assignments.Majoring in chemistry,information science,management,human resource management,accounting,business law,marketing,psychology,excl expert ,education and engineering.I have tutored in other different platforms where my DNA includes three key aspects i.e,quality papers,timely and free from any academic malpractices.I frequently engage clients in each and every step to ensure quality service delivery.This is to ensure sustainability of the tutoring aspects as well as the credibility of the platform.
2+ Reviews
10+ Question Solved
Related Book For 

Communication For Business And Secretarial Students
ISBN: 9780333261750
1st Edition
Authors: Lysbeth A Woolcott, Wendy R Unwin
Question Posted:
