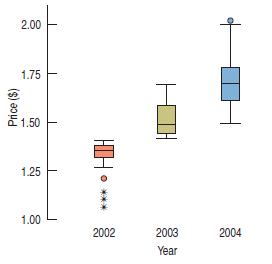
Gas prices, part 2. Below are boxplots of weekly gas prices at a service station in the
Question:
Gas prices, part 2.
Below are boxplots of weekly gas prices at a service station in the Midwest United States
(prices in $ per gallon).

a) Compare the distribution of prices over the three years.
b) In which year were the prices least stable (most volatile)? Explain.
Fantastic news! We've Found the answer you've been seeking!
Step by Step Answer:
Related Book For 

Business Statistics
ISBN: 9780321716095
2nd Edition
Authors: Norean D. Sharpe, Paul F. Velleman, David Bock, Norean Radke Sharpe
Question Posted:


