

How much gas? In Exercise 4 (page 159), we examined the relationship between the average monthly temperature
Question:
How much gas? In Exercise 4 (page 159), we examined the relationship between the average monthly temperature and the amount of natural gas consumed in Joan’s midwestern home. The figure below shows the original scatterplot with the least-squares line added. The equation of the least-squares line is y^ = 1425 − 19.87x.
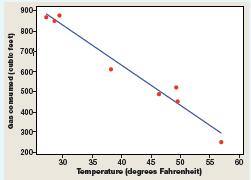
(a) Identify the slope of the line and explain what it means in this setting.
(b) Identify the y intercept of the line. Explain why it’s risky to use this value as a prediction.
(c) Use the regression line to predict the amount of natural gas Joan will use in a month with an average temperature of 30°F.
Fantastic news! We've Found the answer you've been seeking!
Step by Step Answer:

Answered By
VELAMARTHI AVINASH
I have been worked as a expert tutor in Cheggindia.com in the period of 2017-2019. I have dealt two subjects there one is electrical engineering and Calculus with great experience.
0 Reviews
10+ Question Solved
Related Book For 
Question Posted:
