

A random sample of 200 observations was classified into the categories shown in the following table: a.
Question:
A random sample of 200 observations was classified into the categories shown in the following table: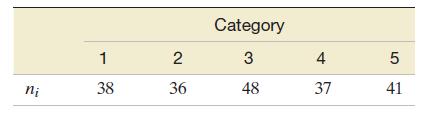
a. Do the data provide sufficient evidence that the categories are not equally likely? Use a = .10.
b. Form a 90% confidence interval for p2, the probability that an observation will fall into category 2.
Fantastic news! We've Found the answer you've been seeking!
Step by Step Answer:

Answered By
Navashree Ghosh
I believe in quality work and customer satisfaction. So, I can assure you that you will get quality work from me when you hire me. Let's work together and build a long-term association.
82+ Reviews
116+ Question Solved
Related Book For 

Statistics Plus New Mylab Statistics With Pearson Etext Access Card Package
ISBN: 978-0134090436
13th Edition
Authors: James Mcclave ,Terry Sincich
Question Posted:
