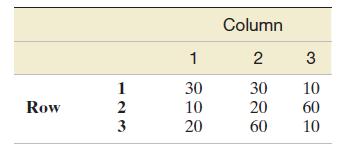
A random sample of 250 observations was classified according to the row and column categories shown in
Question:
A random sample of 250 observations was classified according to the row and column categories shown in the following table:
a. Do the data provide sufficient evidence to conclude that the rows and columns are dependent? Test, using a = .05.
b. Would the analysis change if the row totals were fixed before the data were collected?
c. Do the assumptions required for the analysis to be valid differ according to whether the row (or column) totals are fixed? Explain.
d. Convert the table entries to percentages by using each column total as a base and calculating each row response as a percentage of the corresponding column total. In addition, calculate the row totals and convert them to percentages of all 250 observations.
e. Create a bar graph with the percentages from row 1 on the vertical axis and the column number on the horizontal axis. Draw a horizontal line corresponding to the total percentage for row 1. Does the graph support the result of the test conducted in part a?
f. Repeat part e for the percentages from row 2.
g. Repeat part e for the percentages from row 3.
Step by Step Answer:

Statistics Plus New Mylab Statistics With Pearson Etext Access Card Package
ISBN: 978-0134090436
13th Edition
Authors: James Mcclave ,Terry Sincich


