

Bias and variability. Figure 3.5 shows the behavior of a sample statistic in many samples in four
Question:
Bias and variability. Figure 3.5 shows the behavior of a sample statistic in many samples in four situations. These graphs are like those in Figures 3.1 and 3.2. That is, the heights of the bars show how often the sample statistic took various values in many samples from the same population. The true value of the population parameter is marked on each graph. Label each of the graphs in Figure 3.5 as showing high or low bias and as showing high or low variability.AppendixLO1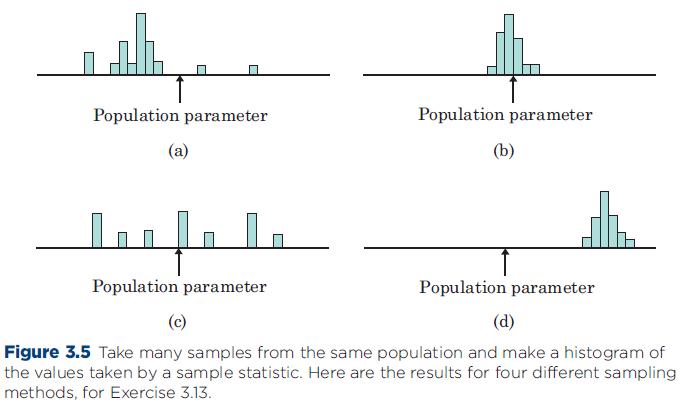
Step by Step Answer:

This question has not been answered yet.
You can Ask your question!
Related Book For 
Statistics Concepts And Controversies
ISBN: 9781429277761
7th Edition
Authors: David S Moore, William I Notz
Question Posted:
