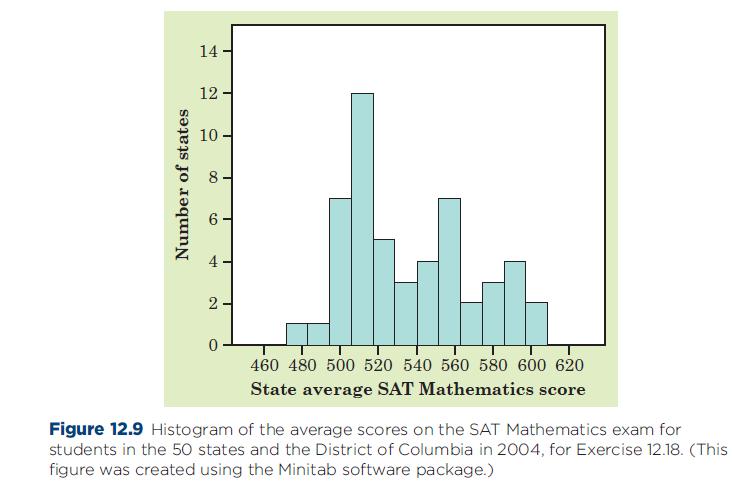
State SAT scores. Figure 12.9 is a histogram of the average scores on the SAT Mathematics exam
Question:
State SAT scores. Figure 12.9 is a histogram of the average scores on the SAT Mathematics exam for students in the 50 states and the District of Columbia in 2004. The distinctive overall shape of this distribution implies that a single measure of center such as the mean or the median is of little value in describing the distribution. Explain why this is true.
Fantastic news! We've Found the answer you've been seeking!
Step by Step Answer:
Related Book For 

Statistics Concepts And Controversies
ISBN: 9781429277761
7th Edition
Authors: David S Moore, William I Notz
Question Posted:


