

Random numbers. If you ask a computer to generate random numbers between 0 and 1, you will
Question:
Random numbers. If you ask a computer to generate “random numbers”
between 0 and 1, you will get observations from a uniform distribution.
Figure 13.12 shows the density curve for a uniform distribution. This curve takes the constant value 1 between 0 and 1 and is zero outside that range. Use this density curve to answer these questions.
(a) Why is the total area under the curve equal to 1?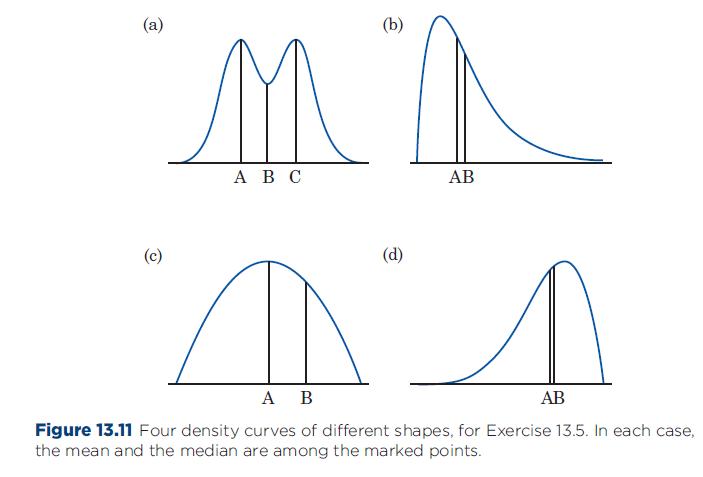
(b) The curve is symmetric. What is the value of the mean and median?
(c) What percentage of the observations lie between 0 and 0.1?
(d) What percentage of the observations lie between 0.6 and 0.9?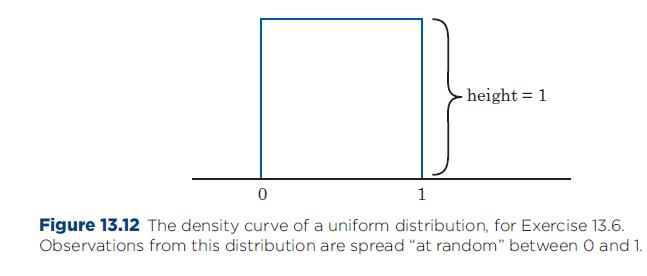
IQ test scores. Figure 13.13 is a stemplot of the IQ test scores of 74 seventhgrade students. This distribution is very close to Normal with mean 111 and standard deviation 11. It includes all the seventh-graders in a rural Midwest school except for 4 low outliers who were dropped because they may have been ill or otherwise not paying attention to the test. Take the Normal distribution with mean 111 and standard deviation 11 as a description of the IQ test scores of all rural Midwest seventh-grade students. Use this distribution and the 68–
95–99.7 rule to answer Exercises 13.7 to 13.9.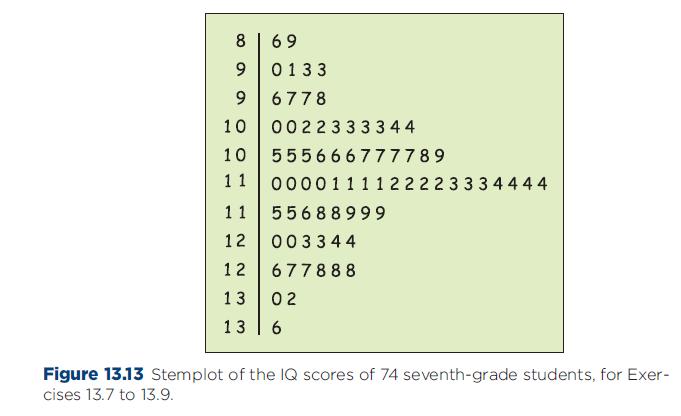
Step by Step Answer:


Statistics Concepts And Controversies
ISBN: 9781429277761
7th Edition
Authors: David S Moore, William I Notz
