

Consider the following pairs of measurements. For these data, SSxx = 38.900, SSyy = 33.600, SSxy =
Question:
Consider the following pairs of measurements.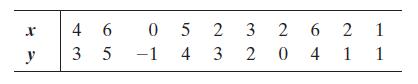
For these data, SSxx = 38.900, SSyy = 33.600, SSxy = 32.8, and yn = -.414 + .843x.
a. Construct a scatterplot of the data.
b. Plot the least squares line on your scatterplot.
c. Use a 95% confidence interval to estimate the mean value of y when xp = 6. Plot the upper and lower bounds of the interval on your scatterplot.
d. Repeat part c for xp = 3.2 and xp = 0.
e. Compare the widths of the three confidence intervals you constructed in parts c and
d, and explain why they differ.
Step by Step Answer:

This question has not been answered yet.
You can Ask your question!
Related Book For 

Statistics Plus New Mylab Statistics With Pearson Etext Access Card Package
ISBN: 978-0134090436
13th Edition
Authors: James Mcclave ,Terry Sincich
Question Posted:
