

Consider the following pairs of measurements. a. Construct a scatterplot of these data. b. Find the least
Question:
Consider the following pairs of measurements.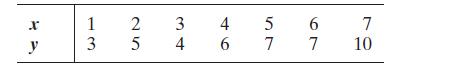
a. Construct a scatterplot of these data.
b. Find the least squares line, and plot it on your scatterplot.
c. Find s2.
d. Find a 90% confidence interval for the mean value of y when x = 4. Plot the upper and lower bounds of the confidence interval on your scatterplot.
e. Find a 90% prediction interval for a new value of y when x = 4. Plot the upper and lower bounds of the prediction interval on your scatterplot.
f. Compare the widths of the intervals you constructed in parts d and
e. Which is wider and why?
Step by Step Answer:

This question has not been answered yet.
You can Ask your question!
Related Book For 

Statistics Plus New Mylab Statistics With Pearson Etext Access Card Package
ISBN: 978-0134090436
13th Edition
Authors: James Mcclave ,Terry Sincich
Question Posted:
