

Exercise 8.39 introduces a study of drug resistant parasites in mice. Figure 8.8 shows boxplots of measures
Question:
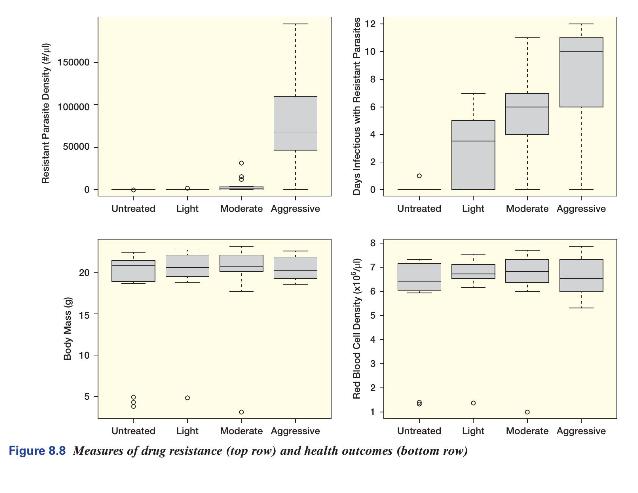
Exercise 8.39 introduces a study of drug resistant parasites in mice. Figure 8.8 shows boxplots of measures of drug resistance and health for mice getting three different doses of antibacterial drug and one untreated group getting no drug. The plot (bottom right) showing red blood cell density \((R B C)\) as the response variable on the vertical axis raises concerns about the normality condition for ANOVA due to a few very low outliers. Eliminate those extreme cases from the data in DrugResistance as well as the untreated group (as in Exercise 8.39), and rerun the ANOVA to look for differences in mean red blood cell density between the three groups that got different doses of the treatment drug. Do the findings change much when the outliers are eliminated?
Data From Exercise 8.39:
Drug resistant pathogens pose one of the major public health challenges of this century. Conventional wisdom is that aggressive treatment should be used to kill pathogens rapidly, before they have a chance to acquire resistance. However, if drug pathogens are already present, this strategy may actually backfire by intensifying the natural selection placed on drug-resistant pathogens. A study took mice and infected them with a mixture of drug-resistant and drug-susceptible malaria parasites, then randomized mice to one of four different treatments of an antimalarial drug (with 18 mice in each group): untreated (no drug), light (4 mg/kg for 1 day), moderate \((8 \mathrm{mg} / \mathrm{kg}\) for 1 day), or aggressive ( 8 \(\mathrm{mg} / \mathrm{kg}\) for 5 or 7 days). Data are available in DrugResistance.
Step by Step Answer:

This question has not been answered yet.
You can Ask your question!


Statistics, Enhanced Unlocking The Power Of Data
ISBN: 9781119308843
2nd Edition
Authors: Robin H Lock, Patti Frazer Lock, Kari Lock Morgan, Eric F Lock, Dennis F Lock
