

The data for a random sample of 10 paired observations are shown in the following table. a.
Question:
The data for a random sample of 10 paired observations are shown in the following table.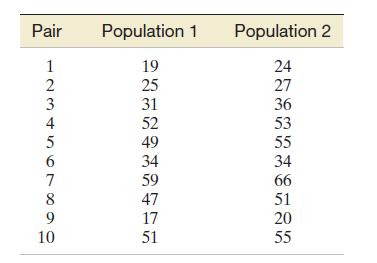
a. If you wish to test whether these data are sufficient to indicate that the mean for population 2 is larger than that for population 1, what are the appropriate null and alternative hypotheses? Define any symbols you use.
b. Conduct the test from part
a, using a = .10. What is your decision?
c. Find a 90% confidence interval for md. Interpret this interval.
d. What assumptions are necessary to ensure the validity of the preceding analysis?
Fantastic news! We've Found the answer you've been seeking!
Step by Step Answer:

Answered By
Khurram shahzad
I am an experienced tutor and have more than 7 years’ experience in the field of tutoring. My areas of expertise are Technology, statistics tasks I also tutor in Social Sciences, Humanities, Marketing, Project Management, Geology, Earth Sciences, Life Sciences, Computer Sciences, Physics, Psychology, Law Engineering, Media Studies, IR and many others.
I have been writing blogs, Tech news article, and listicles for American and UK based websites.
5+ Reviews
17+ Question Solved
Related Book For 

Statistics Plus New Mylab Statistics With Pearson Etext Access Card Package
ISBN: 978-0134090436
13th Edition
Authors: James Mcclave ,Terry Sincich
Question Posted:
