

The data for a random sample of six paired observations are shown in the following table. a.
Question:
The data for a random sample of six paired observations are shown in the following table.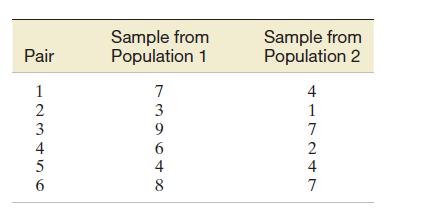
a. Calculate the difference between each pair of observations by subtracting observation 2 from observation 1.
Use the differences to calculate xd and sd 2 .
b. If m1 and m2 are the means of populations 1 and 2, respectively, express md in terms of m1 and m2.
c. Form a 95% confidence interval for md.
d. Test the null hypothesis H0: md = 0 against the alternative hypothesis Ha: md 0. Use a = .05.
Fantastic news! We've Found the answer you've been seeking!
Step by Step Answer:

Answered By
Asim farooq
I have done MS finance and expertise in the field of Accounting, finance, cost accounting, security analysis and portfolio management and management, MS office is at my fingertips, I want my client to take advantage of my practical knowledge. I have been mentoring my client on a freelancer website from last two years, Currently I am working in Telecom company as a financial analyst and before that working as an accountant with Pepsi for one year. I also join a nonprofit organization as a finance assistant to my job duties are making payment to client after tax calculation, I have started my professional career from teaching I was teaching to a master's level student for two years in the evening.
My Expert Service
Financial accounting, Financial management, Cost accounting, Human resource management, Business communication and report writing. Financial accounting : • Journal entries • Financial statements including balance sheet, Profit & Loss account, Cash flow statement • Adjustment entries • Ratio analysis • Accounting concepts • Single entry accounting • Double entry accounting • Bills of exchange • Bank reconciliation statements Cost accounting : • Budgeting • Job order costing • Process costing • Cost of goods sold Financial management : • Capital budgeting • Net Present Value (NPV) • Internal Rate of Return (IRR) • Payback period • Discounted cash flows • Financial analysis • Capital assets pricing model • Simple interest, Compound interest & annuities
65+ Reviews
86+ Question Solved
Related Book For 

Statistics Plus New Mylab Statistics With Pearson Etext Access Card Package
ISBN: 978-0134090436
13th Edition
Authors: James Mcclave ,Terry Sincich
Question Posted:
