The following is a graph of a density function. a. Determine the density function. b. Find the
Question:
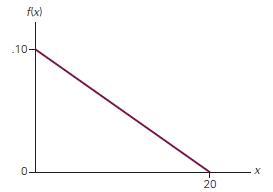
The following is a graph of a density function.

a. Determine the density function.
b. Find the probability that X is greater than 10.
c. Find the probability that X lies between 6 and 12.
Step by Step Answer:
Related Book For 

Statistics For Management And Economics
ISBN: 9781133420774
9th Edition
Authors: Gerald Keller, Kenneth C Louden
Question Posted:


