Use the potential-energy diagram in Figure 42.8 to sketch an approximate graph of the strong force between
Question:
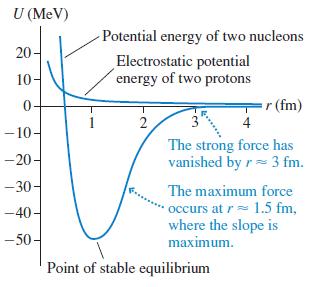
Use the potential-energy diagram in Figure 42.8 to sketch an approximate graph of the strong force between two nucleons versus the distance r between their centers.

Transcribed Image Text:
U (MeV) Potential energy of two nucleons 20- Electrostatic potential energy of two protons 10- r (fm) 4 2 - 10 The strong force has vanished by r= 3 fm. -20 -30- The maximum force occurs at r 1.5 fm, where the slope is maximum. -40- -50- Point of stable equilibrium
Fantastic news! We've Found the answer you've been seeking!
Step by Step Answer:
Answer rating: 64% (14 reviews)
Model The force is the negative of the slope of a potential energy graph Solve The force i...View the full answer

Answered By

Nyron Beeput
I am an active educator and professional tutor with substantial experience in Biology and General Science. The past two years I have been tutoring online intensively with high school and college students. I have been teaching for four years and this experience has helped me to hone skills such as patience, dedication and flexibility. I work at the pace of my students and ensure that they understand.
My method of using real life examples that my students can relate to has helped them grasp concepts more readily. I also help students learn how to apply their knowledge and they appreciate that very much.
4.00+
1+ Reviews
10+ Question Solved
Related Book For 

Physics For Scientists And Engineers A Strategic Approach With Modern Physics
ISBN: 9780321740908
3rd Edition
Authors: Randall D. Knight
Question Posted:
Students also viewed these Mathematics questions
-
Sketch an approximate potential energy diagram similar to that shown in Figures 3.4 and 3.7 for rotation about the carboncarbon bond in 2,2-dimethylpropane. Does the form of the potential energy...
-
Sketch an approximate potential energy diagram similar to that shown in Figures 3.4 and 3.7 for rotation about the carbon-carbon bond in 2,2-dimethylpropane. Does the form of the potential energy...
-
Sketch a potential energy diagram for rotation around a carbon-carbon bond in propane. Clearly identify each potential energy maximum and minimum with a structural formula that shows the conformation...
-
Financial accounting is found when draw up financial statements used as a end of term form of accounting like when a person gets their bank statement or balance sheets. Managerial accounting is more...
-
More shoppers do the majority of their grocery shopping on Saturday than any other day of the week. However, is there a difference in the various age groups in the proportion of people who do the...
-
Departmental Overhead Rates Mariposa, Inc., produces machine tools and currently uses a plantwide overhead rate, based on machine hours. Harry Whipple, the plant manager, has heard that departmental...
-
2. In the preparation of consolidated financial statements, intercompany items for which eliminations will not be made are: a Purchases and sales where the parent employs the equity method b...
-
A scheme for concurrently heating separate water and air streams involves passing them through and over an array of tubes, respectively, while the tube wall is heated electrically. To enhance...
-
Question 1 2 pts Zeke Company sells a single product. The selling price per unit is $32 and unit variable cost is $24. Fixed costs for the year are $100,200. What if selling price goes up by 19%,...
-
Electronic Heaven, Inc., sells electronic merchandise, including a personal computer offered for the first time in September, which retails for $695. Sales of this personal computer for the next...
-
Use the potential-energy diagram in Figure 42.8 to estimate the ratio of the gravitational potential energy to the nuclear potential energy for two neutrons separated by 1.0 fm. U (MeV) Potential...
-
Use the potential-energy diagram in Figure 42.8 to estimate the strength of the strong force between two nucleons separated by 1.5 fm. U (MeV) Potential energy of two nucleons 20- Electrostatic...
-
A two-tank system containing a heated liquid has the model, where T() is the temperature of the fluid flowing into the first tank and T2 is the temperature of the liquid flowing out of the second...
-
Problem 228: The derivative is dz dt = = atb where a , and b =
-
Write a Python program which will take N names from the user. Create a dictionary from the N names that will hold First_name, Middle_name and Last_name in separate keys. The inputs will take N at...
-
2 Finding Poles and Zeros from a Bode Plot Consider the magnitude portion of the Bode plot in Figure 3. Based on the linear approxi- mation in red, find the transfer function G(s). 5 0 -5 10 -10 -15...
-
Indicate whether the following statements are "TRUE" or "FALSE" 1- Financial accounting is considered to be the backbone to top management. 2- Cost accounting identifies, summarizes and interprets...
-
Refer to case 3 shown above. Assume that Beta Division is now receiving an 3% price discount from the outside supplier. a. What is Alpha Division's lowest acceptable transfer price? b. What is Beta...
-
Estimates suggest that 80% of the nitrogen in fertilizer is lost to the environment and does not benefit crops. Investigate the negative side effects of nitrogen fertilizer runoff. If this lost...
-
Chao, Louis, and Mari, unrelated individuals, own all of the shares of Cerise Corporation. All three shareholders have been active in the management of Cerise since its inception. In the current...
-
An object in simple harmonic motion has amplitude 4.0 cm and frequency 4.0 Hz, and at t = 0 s it passes through the equilibrium point moving to the right. Write the function x(t) that describes the...
-
An object in simple harmonic motion has amplitude 4.0 cm and frequency 4.0 Hz, and at t = 0 s it passes through the equilibrium point moving to the right. Write the function x(t) that describes the...
-
a. Describe the difference between and T. Dont just name them; say what is different about the physical concepts they represent. b. Describe the difference between and t 1/2 .
-
Mediocre Company has sales of $120,000, fixed expenses of $24,000, and a net income of $12,000. If sales rose 10%, the new net income would be: Question 18 options: $16,800 $36,000 $13,200 $15,600
-
1. Why might managers of small restaurants decide not to adopt the standard work hour approach to controlling labour cost? (minimum 150 words )
-
Which statement is true regarding the U.S. GAAP impairment test for limited life intangibles? A. U.S. GAAP impairment is likely to be greater than IFRS impairment. B. The impairment test for limited...

Study smarter with the SolutionInn App


