

Question: Data for the phosphorylation reaction, R1, are provided by Caliper Life Sciences, Inc., in Figure 25.15 at high [Pep] (=1.5 mu mathrm{M}) and in Figure
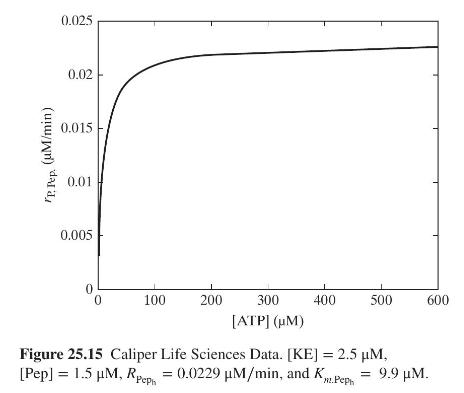
Data for the phosphorylation reaction, R1, are provided by Caliper Life Sciences, Inc., in Figure 25.15 at high [Pep] \(=1.5 \mu \mathrm{M}\) and in Figure 25.16 at high [ATP] \(=250 \mu \mathrm{M}\), both with \([\mathrm{KE}]=2.5 \mu \mathrm{M}\). Using these two curves, find the reaction rate at \([\mathrm{Pep}]=60 \mu \mathrm{M}\) and \([\mathrm{ATP}]=1 \mu \mathrm{M}\), which are well suited to test typical kinase inhibitors and provide a uniform stream of photons for the CCD camera.
![300 400 500 600 [ATP] (M) Figure 25.15 Caliper Life Sciences Data.](https://dsd5zvtm8ll6.cloudfront.net/images/question_images/1713/9/6/4/766662906de1fa271713964765304.jpg)
. . (M/min) 0.025 0.02 0.015 0.01 0.005 0 0 100 200 300 400 500 600 [ATP] (M) Figure 25.15 Caliper Life Sciences Data. [KE] = 2.5 M, [Pep] = 1.5 M, Reph = 0.0229 M/min, and K 1.Peph = 9.9 M.
Step by Step Solution
3.37 Rating (153 Votes )
There are 3 Steps involved in it

Get step-by-step solutions from verified subject matter experts