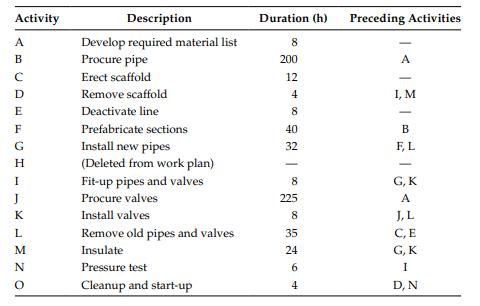
Assume that you are the manager responsible for the project whose data is presented as follows: a.
Question:
Assume that you are the manager responsible for the project whose data is presented as follows:

a. Draw the CPM diagram for this project.
b. Perform the forward and backward pass calculations on the network and indicate the project duration.
c. List all the different paths in the network in decreasing order of criticality index in the tabulated form shown as follows. Define the criticality index as follows:
Let \(S_{k}=\) sum of the TSs on path number \(k\) (i.e., sum of TS values for all activities on path \(k\) ).
\(S_{\max }=\) maximum value of \(S\) (i.e., \(\operatorname{Max}\left\{S_{k}\right\}\) ).
\[ C_{k}=\left[\left(S_{\max }-S_{k}\right) / S_{\max }\right] \times 100 \% \]
Define the most critical path as the one with \(\mathrm{Ck}=100 \%\).
Define the least critical path as the one with \(\mathrm{Ck}=0 \%\).

Step by Step Answer:

Project Management Systems Principles And Applications
ISBN: 272859
2nd Edition
Authors: Adedeji B. Badiru


