

Question: Consider the HIV infection model of Problem 68 in Chapter 6 and its block diagram in Figure P6.17 (Craig, 2004). a. Find the systems type
Consider the HIV infection model of Problem 68 in Chapter 6 and its block diagram in Figure P6.17 (Craig, 2004).
a. Find the system’s type if G(s) is a constant.
b. It was shown in Problem 68, Chapter 6, that when G(s) = K the system will be stable when K 4. What value of K will result in a unit step input steady-state error of 10%?
c. It is suggested that to reduce the steady-state error the system’s type should be augmented by making G(s) = K/s. Is this a wise choice? What is the resulting stability range for K?
Data From Problem 68, Chapter 6:
The HIV infection linearized model developed in Problem 84,Chapter 4, can be shown to have the transfer function
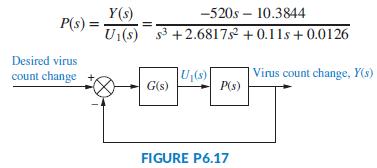
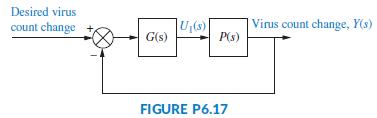
It is desired to develop a policy for drug delivery to maintain the virus count at prescribed levels. For the purpose of obtaining an appropriate u1(t); feedback will be used as shown in Figure P6.17 (Craig, 2004). As a first approach, consider G(s) = K; a constant to be selected. Use the Routh-Hurwitz criteria to find the range of K for which the system is closed-loop stable.
Data from Problem 84,Chapter 4:
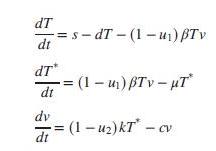
We developed a linearized state-space model of HIV infection. The model assumed that two different drugs were used to combat the spread of the HIV virus. Since this book focuses on single-input, single output systems, only one of the two drugs will be considered. We will assume that only RTIs are used as an input. Thus, in the equations of Chapter 3, Problem 31, u2 = 0 (Craig, 2004).
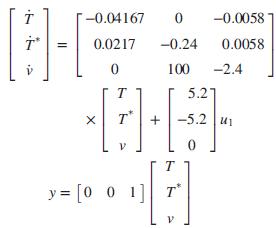
a. Show that when using only RTIs in the linearized system of Problem 31, Chapter 3, and substituting the typical parameter values given in the table of Problem 31c, Chapter 3, the resulting state-space representation for the system is given by
b. Obtain the transfer function from RTI efficiency to virus count; namely, find Y(s)/U1(s).
c. Assuming RTIs are 100% effective, what will be the steady-state change of virus count in a given infected patient? Express your answer in virus copies per ml of plasma. Approximately how much time will the medicine take to reach its maximum possible effectiveness?
Data from Chapter 3, Problem 31:
Y(s) P(s) = U1(s) s3 +2.6817s + 0.11s+0.0126 -520s 10.3844 Desired virus Virus count change, Y(s) P(s) count change U(s) G(s) FIGURE P6.17
Step by Step Solution
3.48 Rating (155 Votes )
There are 3 Steps involved in it
The provided information appears to be a part of a control system analysis problem involving the modeling of HIV infection and the effects of drug del... View full answer

Get step-by-step solutions from verified subject matter experts