

Question: Draw the polar plot from the separate magnitude and phase curves shown in Figure P10.2. -10 -20 -30 -40 0.1 1 10 100 Frequency (rad/s)
Draw the polar plot from the separate magnitude and phase curves shown in Figure P10.2.
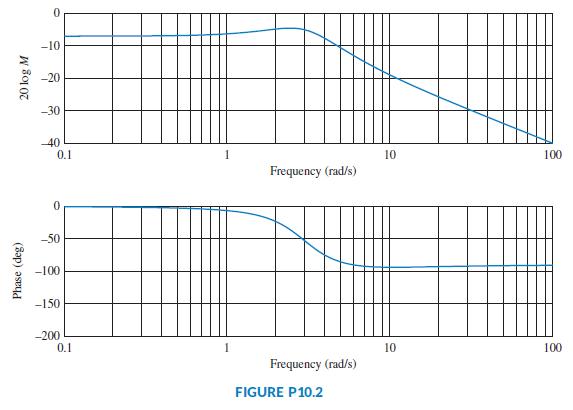
-10 -20 -30 -40 0.1 1 10 100 Frequency (rad/s) -50 -100 -150 -200 0.1 10 100 Frequency (rad/s) FIGURE P10.2 (Sap) seyd 20 log M
Step by Step Solution
★★★★★
3.47 Rating (170 Votes )
There are 3 Steps involved in it
1 Expert Approved Answer
Step: 1 Unlock

Question Has Been Solved by an Expert!
Get step-by-step solutions from verified subject matter experts
Step: 2 Unlock
Step: 3 Unlock