

Question: Draw the separate magnitude and phase curves from the polar plot shown in Figure P10.3. x 103 10 -& 7. 6. -6 2 4 8
Draw the separate magnitude and phase curves from the polar plot shown in Figure P10.3.
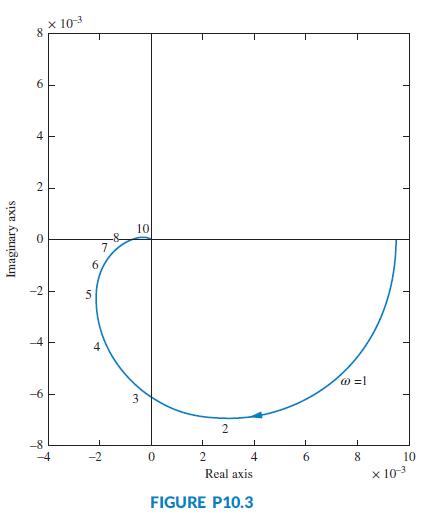
x 103 10 -& 7. 6. -6 2 4 8 10 Real axis x 103 FIGURE P10.3 2. 4. 6. 2. Imaginary axis
Step by Step Solution
★★★★★
3.57 Rating (157 Votes )
There are 3 Steps involved in it
1 Expert Approved Answer
Step: 1 Unlock

Question Has Been Solved by an Expert!
Get step-by-step solutions from verified subject matter experts
Step: 2 Unlock
Step: 3 Unlock