

Question: Compute the linear correlation coefficient for the data in Example 10-1. Example 10-1 The data show the heights in feet and the number of stories
Compute the linear correlation coefficient for the data in Example 10-1.
Example 10-1
The data show the heights in feet and the number of stories of a random selection of six buildings in Chicago, Illinois. Construct a scatter plot for the data.
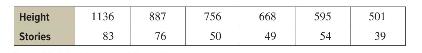
Height 1136 887 756 668 595 501 Stories 83 76 50 49 54 39
Step by Step Solution
★★★★★
3.40 Rating (163 Votes )
There are 3 Steps involved in it
1 Expert Approved Answer
Step: 1 Unlock

Step 1 Make a table as shown here Step 2 Find the values of x y x2 ... View full answer
Question Has Been Solved by an Expert!
Get step-by-step solutions from verified subject matter experts
Step: 2 Unlock
Step: 3 Unlock