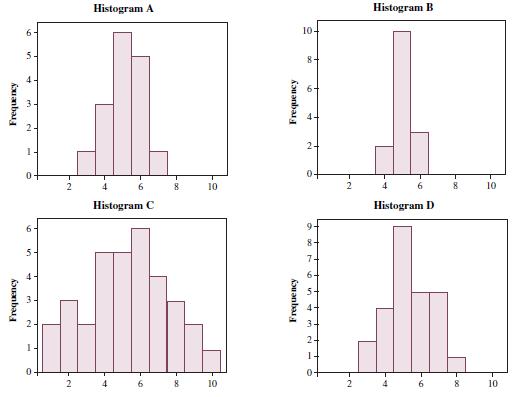
2.56 The levels of various compounds resulted in the distribution graphs that follow. They all seem to
Question:
2.56 The levels of various compounds resulted in the distribution graphs that follow. They all seem to be quite symmetrical about their centers, but they differ in their spreads.
a. For which histogram, A, B, C, or D, would you anticipate the numerical measure of spread to be the largest? the smallest?
b. Which two of the four histograms would you anticipate about the same difference between their smallest values and their largest values?

Fantastic news! We've Found the answer you've been seeking!
Step by Step Answer:
Related Book For 

Just The Essentials Of Elementary Statistics
ISBN: 9780495314875
10th Edition
Authors: Robert Johnson, Patricia Kuby
Question Posted:


