

A paint company collected data on the lifetime (in years) of its paint in eleven United States
Question:
A paint company collected data on the lifetime (in years) of its paint in eleven United States cities. The data are in the following table.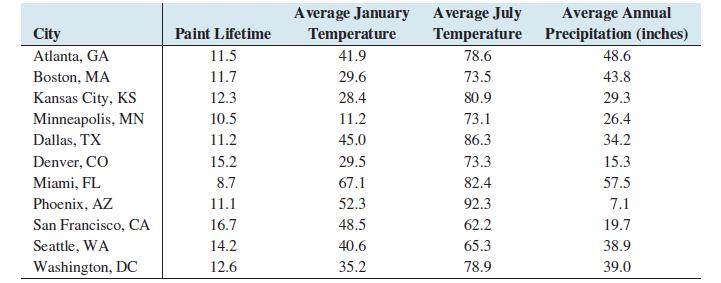
a. Let y represent paint lifetime, x1 represent January temperature, x2 represent July temperature, and x3 represent annual precipitation.
Construct the multiple regression equation ̂y = b0 + b1x1 + b2x2 + b3x3.
b. In Cheyenne, Wyoming, the average January temperature is 26.1, the average July temperature is 68.9, and the average annual precipitation is 13.3. Predict the lifetime of this paint in Cheyenne.
c. Refer to part (b). Construct a 95% confidence interval for the paint lifetime in Cheyenne.
d. Refer to part (b). Construct a 95% prediction interval for the paint lifetime in Cheyenne.
e. What percentage of the variation in the paint lifetime in Cheyenne is explained by the model?
f. Is the model useful for prediction? Why or why not? Use the α = 0.05 level.
g. Test H0: β1 = 0 versus H1: β1 ≠ 0 at the α = 0.05 level. Can you reject H0? Repeat for β2 and β3.
Step by Step Answer:


