

The Outlook for business travelers graphic shows two circle graphs, each with four sections. This same information
Question:
The “Outlook for business travelers” graphic shows two circle graphs, each with four sections.
This same information could be represented in the form of a 2 4 contingency table of two qualitative variables.
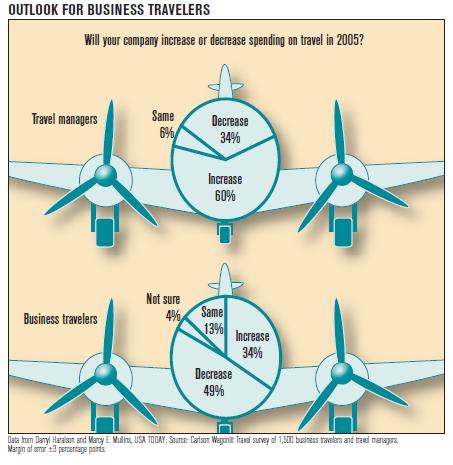
a. Identify the population and name the two variables.
b. Construct the contingency table using entries of percentages based on row totals.
Fantastic news! We've Found the answer you've been seeking!
Step by Step Answer:

Answered By
Anjali Arora
Having the experience of 16 years in providing the best solutions with a proven track record of technical contribution and appreciated for leadership in enhancing team productivity, deliverable quality, and customer satisfaction. Expertise in providing the solution in Computer Science, Management, Accounting, English, Statistics, and Maths.
Also, do website designing and Programming.
Having 7 yrs of Project Management experience.
100% satisfactory answers.
3+ Reviews
10+ Question Solved
Related Book For 

Just The Essentials Of Elementary Statistics
ISBN: 9780495314875
10th Edition
Authors: Robert Johnson, Patricia Kuby
Question Posted:
