

The perfect age graphic shows the results from a 9 2 contingency table for one qualitative and
Question:
“The perfect age” graphic shows the results from a 9 2 contingency table for one qualitative and one quantitative variable.
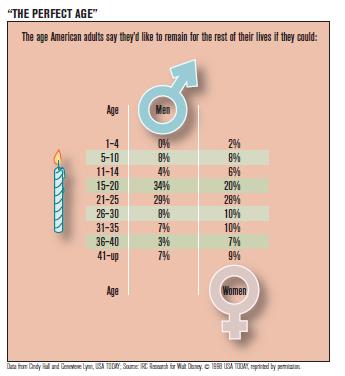
a. Identify the population and name the qualitative and quantitative variables.
b. Construct a bar graph showing the two distributions side by side.
c. Does there seem to be a big difference between the genders on this subject?
Step by Step Answer:

This question has not been answered yet.
You can Ask your question!
Related Book For 

Just The Essentials Of Elementary Statistics
ISBN: 9780495314875
10th Edition
Authors: Robert Johnson, Patricia Kuby
Question Posted:
