

This bar graph shows the number of registered automobiles in each of several countries. a. Name at
Question:
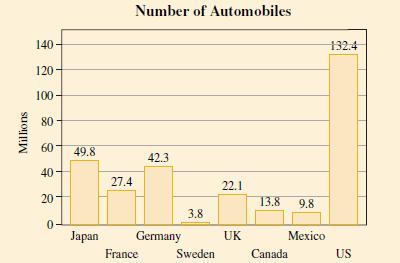
This bar graph shows the number of registered automobiles in each of several countries.
a. Name at least two countries not included in the information.
b. Why are all probabilities resulting from these information conditional probabilities?
Based on the information in the accompanying graph:
c. What percentage of all cars in these countries is registered in the United States?
d. If one registered car was selected at random from all of these cars, what is the probability that it is registered in the United States?
e. Explain the relationship between your answers to parts c and d.
Step by Step Answer:

This question has not been answered yet.
You can Ask your question!
Related Book For 

Just The Essentials Of Elementary Statistics
ISBN: 9780495314875
10th Edition
Authors: Robert Johnson, Patricia Kuby
Question Posted:
