

Table 5.5 shows a small set of predictive model holdout partition results for a classification model, with
Question:
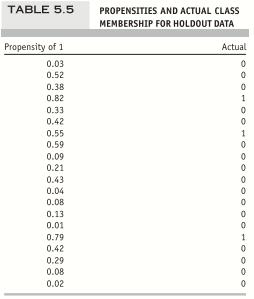
Table 5.5 shows a small set of predictive model holdout partition results for a classification model, with both actual values and propensities.
a. Calculate error rates, sensitivity, and specificity using threshold values of 0.25, 0.5, and 0.75.
b. Create a lift chart using Excel, similar to Figure 5.9.
Fantastic news! We've Found the answer you've been seeking!
Step by Step Answer:

Answered By
Nyron Beeput
I am an active educator and professional tutor with substantial experience in Biology and General Science. The past two years I have been tutoring online intensively with high school and college students. I have been teaching for four years and this experience has helped me to hone skills such as patience, dedication and flexibility. I work at the pace of my students and ensure that they understand.
My method of using real life examples that my students can relate to has helped them grasp concepts more readily. I also help students learn how to apply their knowledge and they appreciate that very much.
1+ Reviews
10+ Question Solved
Related Book For 
Machine Learning For Business Analytics
ISBN: 9781119828792
1st Edition
Authors: Galit Shmueli, Peter C. Bruce, Amit V. Deokar, Nitin R. Patel
Question Posted:
