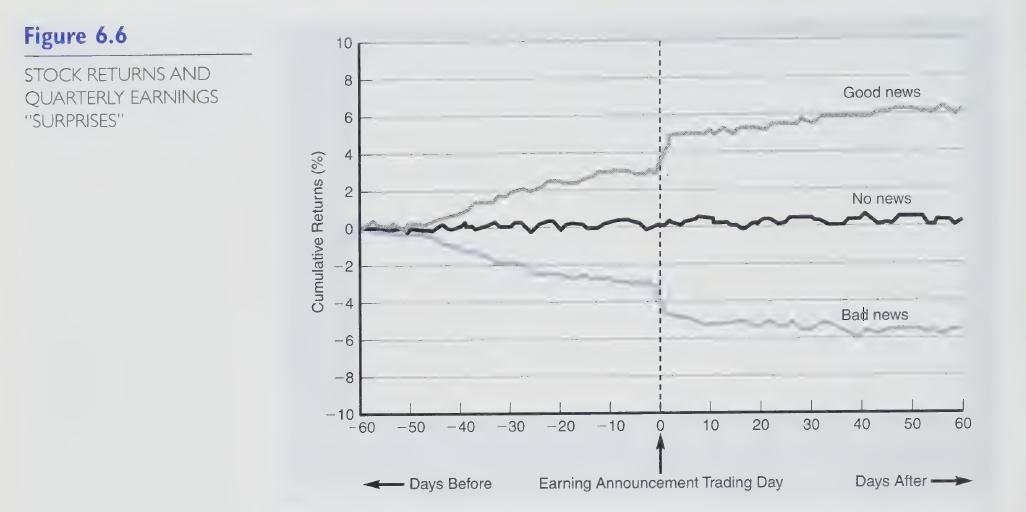
Figure 6.6 in this chapter illustrates the behavior of stock returns over the period before a quarterly
Question:
Figure 6.6 in this chapter illustrates the behavior of stock returns over the period before a quarterly earnings announcement (from trading days —60 to —1); at the time of an earnings announcement (on day 0); and over the period following an earnings announcement (from trading days +1 to +60) for three groups of firms. (Note: A 60-trading-day period is almost equal to the 90 calendar days that make up a fiscal quarter.) The three groups are “good news”
firms (firms whose earnings are higher than the market expected), “no news” firms (firms whose earnings are what the market expected), and “bad news” firms (firms whose earnings are lower than what the market expected).
 Required:
1. Why do the stock returns of good news firms drift upward before the earnings announcement date?
2. Why do the stock returns of bad news firms drift downward before the earnings announcement date?
3. Why don’t the stock returns of no news firms drift upward or downward during the —60 to —1 trading day period?
4. For each group, explain the behavior of the stock returns at the time of the earnings announcement (on trading day 0).
5. While not immediately obvious from Figure 6.6, the stock returns of good news firms tend to continue to drift upward after the earnings announcement, and the stock returns of bad news firms tend to continue to drift downward after the earnings announcement.
Explain why these post announcement drifts occur.
6. Suppose a separate Figure 6.6 were produced for a sample f large publicly traded firms and for a sample of small publicly traded firms. Would you expect the two figures to look the same? Explain why or why not.
Step by Step Answer:


