Question:
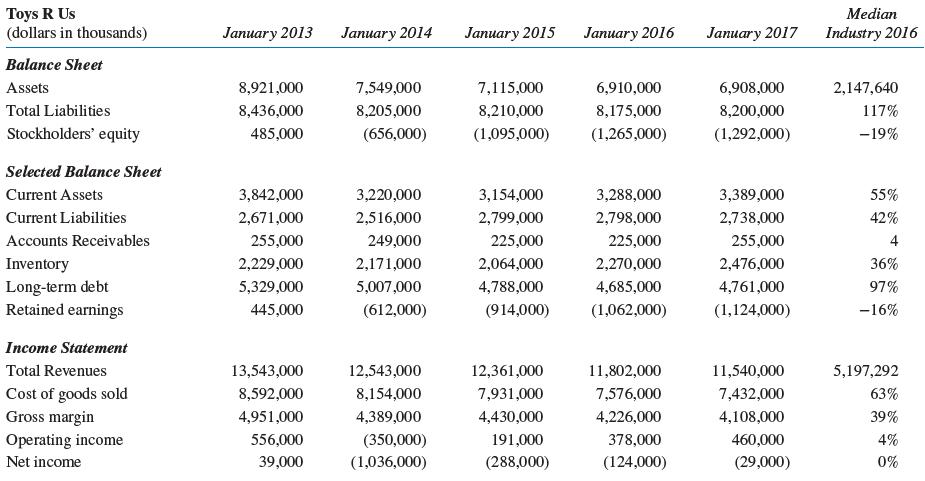
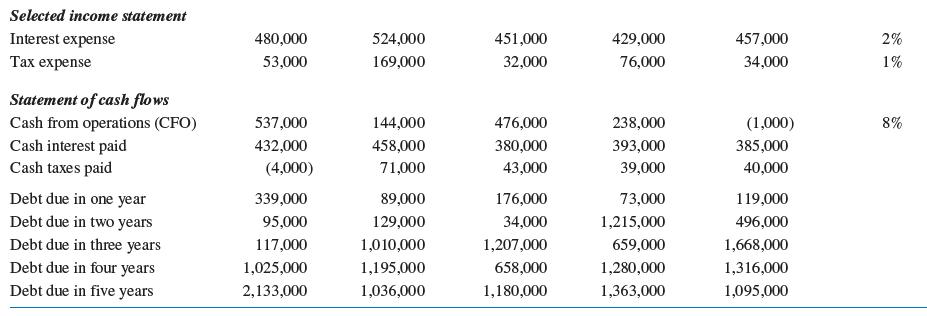
The following information is available for Toys “R” Us Stores from January 2013 through January 2017. In the last column, the median industry values are reported for Retail- Hobby, Toy, and Game Shops. Assets and revenues are in millions of dollars, balance sheet percentages are a percentage of total assets, income statement percentages are a percentage of total revenues, and the statements of cash flow percentages are a percentage of total assets.

Required:
1. Evaluate the performance of Toys R Us over time. Is there a year, where you first become concerned about the likelihood of bankruptcy?
2. Because Toys R Us is a private company, the market value of equity is unknown. Compute the Z- score for private firms. Make an assessment of the likelihood of bankruptcy during 2018.
Transcribed Image Text:
Toys R Us
(dollars in thousands)
Balance Sheet
Assets
Total Liabilities
Stockholders' equity
Selected Balance Sheet
Current Assets
Current Liabilities
Accounts Receivables
Inventory
Long-term debt
Retained earnings
Income Statement
Total Revenues
Cost of goods sold
Gross margin
Operating income
Net income
January 2013
8,921,000
8,436,000
485,000
3,842,000
2,671,000
255,000
2,229,000
5,329,000
445,000
13,543,000
8,592,000
4,951,000
556,000
39,000
January 2014
7,549,000
8,205,000
(656,000)
3,220,000
2,516,000
249,000
2,171,000
5,007,000
(612,000)
12,543,000
8,154,000
4,389,000
(350,000)
(1,036,000)
January 2015
January 2016
7,115,000
6,910,000
8,210,000
8,175,000
(1,095,000) (1,265,000)
12,361,000
7,931,000
4,430,000
191,000
(288,000)
3,154,000
2,799,000
225,000
2,064,000
2,270,000
4,788,000
4,685,000
(914,000) (1,062,000)
3,288,000
2,798,000
225,000
11,802,000
7,576,000
4,226,000
378,000
(124,000)
January 2017
6,908,000
8,200,000
(1,292,000)
3,389,000
2,738,000
255,000
2,476,000
4,761,000
(1,124,000)
11,540,000
7,432,000
4,108,000
460,000
(29,000)
Median
Industry 2016
2,147,640
117%
-19%
55%
42%
4
36%
97%
-16%
5,197,292
63%
39%
4%
0%


