1.10. The accompanying diagram illustrates your local electricity companys natural monopoly. The diagram shows the demand curve...
Question:
1.10. The accompanying diagram illustrates your local electricity company’s natural monopoly. The diagram shows the demand curve for kilowatt-hours (kWh) of electricity, the company’s marginal revenue (MR) curve, its marginal cost (MC) curve, and its average total cost (ATC) curve. The government wants to regulate the monopolist by imposing a price ceiling.
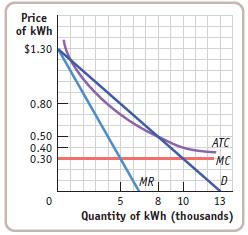
a. If the government does not regulate this monopolist, which price will it charge? Illustrate the inefficiency this creates by shading the deadweight loss from monopoly.
b. If the government imposes a price ceiling equal to the marginal cost, $0.30, will the monopolist make profits or lose money? Shade the area of profit (or loss) for the monopolist. If the government does impose this price ceiling, do you think the firm will continue to produce in the long run?
c. If the government imposes a price ceiling of $0.50, will the monopolist make a profit, lose money, or break even?
Step by Step Answer: