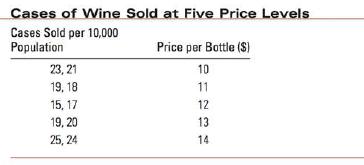
A distributor of table wines conducted a study of the relationship between price and demand using a
Question:
A distributor of table wines conducted a study of the relationship between price and demand using a type of wine that ordinarily sells for $10 per bottle. He sold this wine in ten different marketing areas over a 12-month period, using five different price lev- els-from $10 to $14. The data are given in Table 3.4. Construct a scatterplot for the data, and use the graph to describe the relationship between price and demand.

Step by Step Answer:
Related Book For 

Introduction To Probability And Statistics
ISBN: 9780176509804
3rd Edition
Authors: William Mendenhall
Question Posted:


