

An experiment designed to compare two treatments against corrosion yielded the following data in pieces of wire
Question:
An experiment designed to compare two treatments against corrosion yielded the following data in pieces of wire subjected to the two treatments.
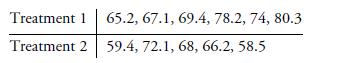
(The data represent the maximum depth of pits in units of one thousandth of an inch.)
The ordered values are 58.5, 59.4, 65.2∗, 66.2, 67.1∗, 68, 69.4∗, 72.1, 74∗, 78.2∗, 80.3∗
with an asterisk noting that the data value was from sample 1. Hence, the value of the test statistic is T = 3 + 5 + 7 + 9 + 10 + 11 = 45
Fantastic news! We've Found the answer you've been seeking!
Step by Step Answer:

Answered By
Bhartendu Goyal
Professional, Experienced, and Expert tutor who will provide speedy and to-the-point solutions. I have been teaching students for 5 years now in different subjects and it's truly been one of the most rewarding experiences of my life. I have also done one-to-one tutoring with 100+ students and help them achieve great subject knowledge. I have expertise in computer subjects like C++, C, Java, and Python programming and other computer Science related fields. Many of my student's parents message me that your lessons improved their children's grades and this is the best only thing you want as a tea...
2+ Reviews
10+ Question Solved
Related Book For 

Introduction To Probability And Statistics For Engineers And Scientists
ISBN: 9780125980579
3rd Edition
Authors: Sheldon M. Ross
Question Posted:
