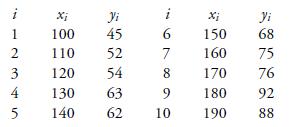
Consider the following 10 data pairs (xi , yi ), i = 1, . . . ,
Question:
Consider the following 10 data pairs (xi , yi ), i = 1, . . . , 10, relating y, the percent yield of a laboratory experiment, to x, the temperature at which the experiment was run.

A plot of yi versus xi — called a scatter diagram — is given in Figure 9.1. As this scatter diagram appears to reflect, subject to random error, a linear relation between y and x, it seems that a simple linear regression model would be appropriate
Step by Step Answer:
Related Book For 

Introduction To Probability And Statistics For Engineers And Scientists
ISBN: 9780125980579
3rd Edition
Authors: Sheldon M. Ross
Question Posted:


