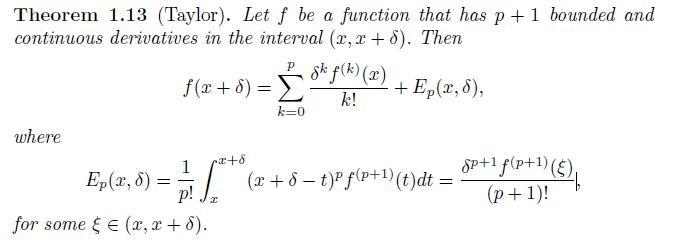
Refer to the three approximations derived for each of the four functions in Exercise 26. For each
Question:
Refer to the three approximations derived for each of the four functions in Exercise 26. For each function use \(\mathrm{R}\) to construct a line plot of the error terms \(E_{2}(x, \delta)\) and \(E_{3}(x, \delta)\) relative to the error term \(E_{1}(x, \delta)\). That is, for each function, plot \(E_{2}(x, \delta) / E_{1}(x, \delta)\) and \(E_{3}(x, \delta) / E_{1}(x, \delta)\) versus \(\delta\). The lines corresponding to each relative error function should be different. What do these plots suggest about the relative error rates?
Exercise 26
Use Theorem 1.13 with \(p=1,2\) and 3 to find approximations for each of the functions listed below for small values of \(\delta\).
a. \(f(\delta)=1 /(1+\delta)\)
b. \(f(\delta)=\sin ^{2}(\pi / 4+\delta)\)
c. \(f(\delta)=\log (1+\delta)\)
d. \(f(\delta)=(1+\delta) /(1-\delta)\)

Step by Step Answer:


