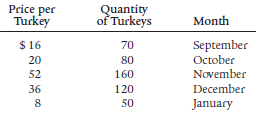
The following table shows the relationship between the price of organic turkeys and the number of turkeys
Question:
a. Is the relationship between the price of turkeys and the number of turkeys sold by Godfrey€™s Free-Range Gobblers a positive relationship or a negative relationship?
Explain.
b. Plot the data from the table on a graph, draw a line through the points, and calculate the slope of the line.

Fantastic news! We've Found the answer you've been seeking!
Step by Step Answer:
Related Book For 

Principles of Macroeconomics
ISBN: 978-0134078809
12th edition
Authors: Karl E. Case, Ray C. Fair, Sharon E. Oster
Question Posted:


