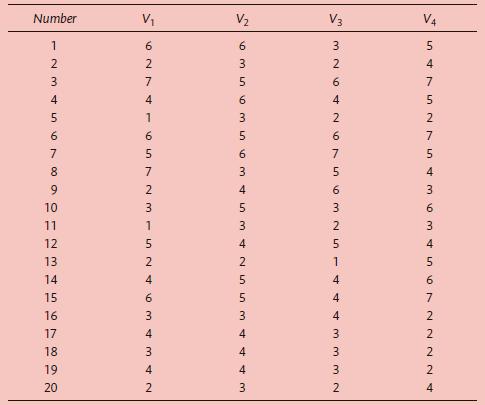
1.4 In a survey pre-test, data were obtained from 20 participants on preference for boots (V1) on...
Question:
1.4 In a survey pre-test, data were obtained from 20 participants on preference for boots (V1) on a seven-point scale (1 = not preferred, 7 = greatly preferred). The participants also provided their evaluations of the boots on comfort (V2), style
(V3) and durability (V4), also on seven-point scales (1 = poor, 7 = excellent). The resulting data are given in the following table:

a Calculate the simple correlations between V1 and V4 and interpret the results.
b Run a bivariate regression with preference for boots (V1) as the dependent variable and evaluation on comfort (V2) as the independent variable. Interpret the results.
c Run a bivariate regression with preference for boots (V1) as the dependent variable and evaluation on style (V3) as the independent variable. Interpret the results.
d Run a bivariate regression with preference for boots (V1) as the dependent variable and evaluation on durability (V4) as the independent variable. Interpret the results.
e Run a multiple regression with preference for boots (V1) as the dependent variable and V2 to V4 as the independent variables. Interpret the results. Compare the coefficients for V2, V3 and V4 obtained in the bivariate and the multiple regressions.
Step by Step Answer:

Marketing Research: An Applied Approach
ISBN: 187936
5th Edition
Authors: Malhotra, Naresh K;Nunan, Daniel(Contributor);Birks, David F(Contributor)


