All Matches
Solution Library
Expert Answer
Textbooks
Search Textbook questions, tutors and Books
Oops, something went wrong!
Change your search query and then try again
Toggle navigation
FREE Trial
S
Books
FREE
Tutors
Study Help
Expert Questions
Accounting
General Management
Mathematics
Finance
Organizational Behaviour
Law
Physics
Operating System
Management Leadership
Sociology
Programming
Marketing
Database
Computer Network
Economics
Textbooks Solutions
Accounting
Managerial Accounting
Management Leadership
Cost Accounting
Statistics
Business Law
Corporate Finance
Finance
Economics
Auditing
Hire a Tutor
AI Study Help
New
Search
Search
Sign In
Register
study help
mathematics
basic technical mathematics
Questions and Answers of
Basic Technical Mathematics
Find the indicated measures of central tendency.Median of the miles traveled in Exercise 15Data from Exercises 15 of Exercises 22.1Use the following data. In testing a new electric engine, an
Find the indicated measures of central tendency.Mean of the miles traveled in Exercise 15Data from Exercises 15 of Exercises 22.1Use the following data. In testing a new electric engine, an
Find the indicated measures of central tendency.Mode of the miles traveled in Exercise 15Data from Exercises 15 of Exercises 22.1Use the following data. In testing a new electric engine, an
Find the standard deviation for the indicated sets of numbers. A calculator may be used.The salaries in Exercise 29 of Section 22.2Data from Exercises 29 of Section 22.2The weekly salaries (in
Find the indicated measures of central tendency.Median of the number of apps in Exercise 19Data from Exercises 19 of Exercises 22.1Use the following data. In a random sample, 30 Android users were
Find the indicated measures of central tendency.Mean of the number of apps in Exercise 19Data from Exercises 19 of Exercises 22.1Use the following data. In a random sample, 30 Android users were
The ASCII code assigns a decimal number between 0 and 127 for each character on a computer keyboard. When a key is pressed, the computer converts the character to an 8-bit binary number. For example,
Find the indicated regression model for the following data. Using aerial photography, the area A (in km2) of an oil spill as a function of the time t (in h) after the spill was found to be as
The sales (in millions of dollars) for a company is shown below. Make a time series plot of the data. Year 2018 2019 2020 2021 Sales 1.2 1.4 1.6 1.5 2022 1.8
Convert each decimal number to binary.74
In an electrical experiment, the following data were found for the values of current and voltage for a particular element of the circuit. Find the voltage V as a function of the current i. Then
Use Eq. (22.3) to find the standard deviation s for the indicated sets of numbers.Eq. 22.3Set AA: 3, 6, 4, 2, 5, 4, 7, 6, 3, 4, 6, 4, 5, 7, 3 S = 2 n(Σκ) - (Σ») n( n − 1)
In an experiment to measure cosmic radiation, the number of cosmic rays was recorded for 200 different 5-s intervals. The grouped data are shown below:Find the mean. No. of Cosmic Rays Frequency 0
In a random sample, 30 Android users were asked to record the number of apps that were installed on their phone. The resulting data are shown below:Make a relative frequency histogram using the
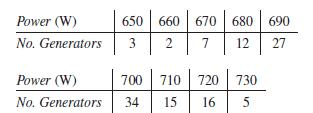
A sample of wind generators was tested for power output when the wind speed was 30 km/h. The following table gives the powers produced (to the nearest 10 W) and the number of generators for each
The dosage (in mR) given by a particular X-ray machine was measured 20 times, with the following readings:Using the class limits 3.80, 3.90, 4.00, . . . , 4.60, construct a frequency histogram of
Median of X-ray dosages in Exercise 25Data from Exercises 25 of Exercises 22.1Use the following data. The dosage (in mR) given by a particular X-ray machine was measured 20 times, with the following
The dosage (in mR) given by a particular X-ray machine was measured 20 times, with the following readings:Make a stem-and-leaf plot of these data (without split stems). 4.25, 4.36, 3.96, 4.21, 4.44,
In an experiment to measure cosmic radiation, the number of cosmic rays was recorded for 200 different 5-s intervals. The grouped data are shown below:Find the median. No. of Cosmic Rays Frequency 0
The blood alcohol level (in %) in the bloodstreams of those charged with DUI at a police check point were as follows:Using the class limits 0.06, 0.08, 0.10, . . . , 0.18, make a frequency histogram
With 75.8% of the area under the normal curve to the right of z, find the z-value.
Mode of X-ray dosages in Exercise 25Data from Exercises 25 of Exercises 22.1Use the following data. The dosage (in mR) given by a particular X-ray machine was measured 20 times, with the following
With 21% of the area under the normal curve between z1 and z2, to the right of z1 = 0.8, find z2.
Mean of the bloodstream alcohol percentages in Exercise 27Data from Exercises 27 of Exercises 22.1Use the following data. The blood alcohol level (in %) in the bloodstreams of those charged with DUI
In an experiment to measure cosmic radiation, the number of cosmic rays was recorded for 200 different 5-s intervals. The grouped data are shown below:Find the standard deviation. No. of
The blood alcohol level (in %) in the bloodstreams of those charged with DUI at a police check point were as follows:Find the relative frequencies (to the nearest tenth of a percent) for the classes
In an experiment to measure cosmic radiation, the number of cosmic rays was recorded for 200 different 5-s intervals. The grouped data are shown below:Make a relative frequency table. No. of
With 59% of the area under the normal curve between z1 and z2, to the left of z2 = 1.1,find z1.
The data in the table show the global mean land-ocean temperature index (using a base period of 1951–1980) for various years. Make a time series graph of these data. Year Temperature index
Median of the bloodstream alcohol percentages in Exercise 27Data from Exercises 27 of Exercises 22.1Use the following data. The blood alcohol level (in %) in the bloodstreams of those charged with
For the data on the number of Android apps in Exercise 19 of Section 22.1, find the percent of the data that lie within one, two, and three standard deviations of the mean. Compare these percentages
With 5.8% of the area under the normal curve between z1 and z2, to the left of z2 = 2.0, find z1
The data in the following table show the percentage of U.S. households that have a landline telephone for various years. Make a time series graph of these data. Year 2012 Percentage (%) 60 2014 2016
Mode of the bloodstream alcohol percentages in Exercise 27Data from Exercises 27 of Exercises 22.1Use the following data. The blood alcohol level (in %) in the bloodstreams of those charged with DUI
In a particular month, the electrical usages, rounded to the nearest 100kW · h (kilowatt-hours), of 1000 homes in a certain city were summarized as follows:Find the mean of the electrical usage.
According to the empirical rule, approximately what percentage of IQ scores are between 70 and 130?IQ scores are normally distributed with a mean μ = 100 and a standard deviation σ = 15.
The residents of a city suburb live at a mean distance of 16.0 km from the center of the city, with a standard deviation of 4.0 km. What percent of the residents live between 12.0 km and 18.0 km of
Find the median and mode of electrical usage in Exercise 31.Data from Exercises 31In a particular month, the electrical usages, rounded to the nearest 100kW · h (kilowatt-hours), of 1000 homes in a
The weekly salaries (in dollars) for the workers in a small factory are as follows:600, 750, 625, 575, 525, 700, 550,750, 625, 800, 700, 575, 600, 700Find the median and the mode of the salaries.
The diameters of a sample of fiber-optic cables were measured (to the nearest 0.0001 mm) with the following results.Find the mean of the diameters. Diameter (mm) No. Cables 0.0057 0.0057 0.0058
According to the empirical rule, approximately what percentage of IQ scores are between 55 and 145?IQ scores are normally distributed with a mean μ = 100 and a standard deviation σ = 15.
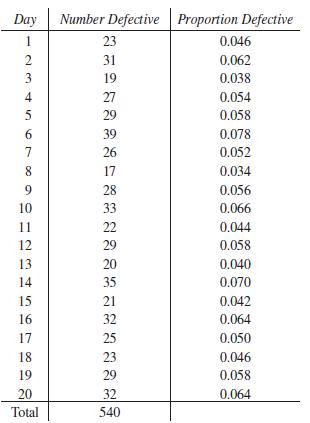
A company that makes LED light bulbs tests 500 bulbs each day for defects. The number of defective bulbs, along with the proportion of defective bulbs for 20 days, is shown in the following
A company that makes LED light bulbs tests 500 bulbs each day for defects. The number of defective bulbs, along with the proportion of defective bulbs for 20 days, is shown in the following table.For
Find the mean salary for the salaries in Exercise 29.Data from Exercises 29The weekly salaries (in dollars) for the workers in a small factory are as follows:600, 750, 625, 575, 525, 700, 550,750,
Find and interpret the z-score of an IQ of 127.IQ scores are normally distributed with a mean μ = 100 and a standard deviation σ = 15.
Find the IQ score that has a z-score of −1.2.IQ scores are normally distributed with a mean μ = 100 and a standard deviation σ = 15.
Find the median and mode of the diameters in Exercise 33.Data from Exercises 33The diameters of a sample of fiber-optic cables were measured (to the nearest 0.0001 mm) with the following results.
Five ball bearings are taken from the production line every 15 min and their diameters are measured. The diameters of the sample ball bearings for 16 successive subgroups are given in the following
A test of air pollution in a city gave the following readings of the concentration of sulfur dioxide (in parts per million) for 18 consecutive days:0.14, 0.18, 0.27, 0.19, 0.15, 0.22, 0.20, 0.18,
Find the mean of the readings in Exercise 35.Data from Exercises 35A test of air pollution in a city gave the following readings of the concentration of sulfur dioxide (in parts per million) for 18
Find the area under the standard normal curve between z = −1.6 and z = 2.1.
The midrange, another measure of central tendency, is found by finding the sum of the lowest and the highest values and dividing this sum by 2. Find the midrange of the salaries in Exercise 29.Data
Find the area under the standard normal curve to the right of z = 0.9.
Find the midrange of the sulfur dioxide readings in Exercise 35.Data from Exercises 35A test of air pollution in a city gave the following readings of the concentration of sulfur dioxide (in parts
Find the two z-scores that bound the middle 83.84% of the area under the standard normal curve.
Add $100 to each of the salaries in Exercise 29. Then find the median, mean, and mode of the resulting salaries. State any conclusion that might be drawn from the results.Data from Exercises 29The
Find the z-score that has an area to the right of 0.0287 under the standard normal curve.
Multiply each of the salaries in Exercise 29 by 2. Then find the median, mean, and mode of the resulting salaries. State any conclusion that might be drawn from the results.Data from Exercises 29The
After analyzing data for a long period of time, it was determined that the readings of an organic pollutant for an area are distributed normally with μ = 2.20 μg/m3 and σ = 0.50 μg/m3.What
Change the final salary in Exercise 29 to $4000, with all other salaries being the same. Then find the mean of these salaries. State any conclusion that might be drawn from the result. (The $4000
In a certain experiment, the resistance R of a certain resistor was measured as a function of the temperature T. The data found are shown in the following table. Find the regression line that
After analyzing data for a long period of time, it was determined that the readings of an organic pollutant for an area are distributed normally with μ = 2.20 μg/m3 and σ = 0.50 μg/m3.What
An air-pollution monitoring station took samples of air each hour during the later morning hours and tested each sample for the number n of parts per million (ppm) of carbon monoxide. The results are
Find the median and mode of the salaries indicated in Exercise 41. State any conclusion that might be drawn from the results.Data from Exercises 41Change the final salary in Exercise 29 to $4000,
The Mach number of a moving object is the ratio of its speed to the speed of sound (740 mi/h). The following table shows the speed s of a jet aircraft, in terms of Mach numbers, and the time t after
After analyzing data for a long period of time, it was determined that the readings of an organic pollutant for an area are distributed normally with μ = 2.20 μg/m3 and σ = 0.50 μg/m3.What
The ASCII code assigns a decimal number between 0 and 127 for each character on a computer keyboard. When a key is pressed, the computer converts the character to an 8-bit binary number. For example,
Convert the given binary number to hexadecimal.1001 1110
Indicate whether the variable is qualitative or quantitative.The diameter of a bolt
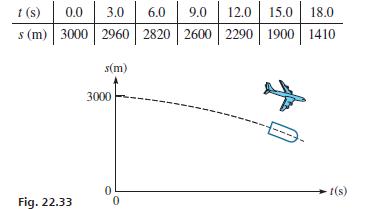
The distance s of a missile above the ground at time t after being released from a plane is given by the following table (see Fig. 22.33). Find the equation of the quadratic regression model for
In an experiment to determine the relation between the load x on a spring and the length y of the spring, the following data were found. Find the regression line that expresses y as a function of x.
In an elementary experiment that measured the wavelength L of sound as a function of the frequency f, the following results were obtained.Find the equation of the exponential regression model for
For the data in Exercise 50, find equations for the quadratic, logarithmic, and power regression models. Which of these three models fits the data the least well?Data from Exercises 50Find the
The power P (in W) generated by a wind turbine was measured for various wind velocities v (in mi/h), as shown in the following table.Find the equation of the cubic regression model for these data. v
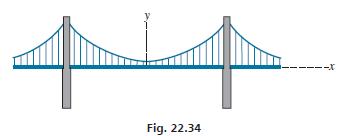
The vertical distance y of the cable of a suspension bridge above the surface of the bridge is measured at a horizontal distance x along the bridge from its center. See Fig. 22.34. The results are as
The chlorine residual r (in ppm—parts per million) was measured in a swimming pool every 12 h after chemical treatment, with the following results:Find the equation of the exponential regression
Show that Eqs. (22.8) and (22.9) satisfy the equation ȳ = mx̄ + b.Data from Eq.(22.8) m "Σ" - (Σ.Σ.) ηΣχ2 - (Σκ) 2
Find the indicated regression model for the following data. Using aerial photography, the area A (in km2) of an oil spill as a function of the time t (in h) after the spill was found to be as
A research institute is planning a study of the effect of education on the income of workers. Explain what data should be collected and which of the measures discussed in this chapter would be useful
Convert the hexadecimal number to decimal.4A
Convert each binary number to decimal.101
Convert the hexadecimal number to decimal.B7
Convert each binary number to decimal. 1100
Convert the hexadecimal number to decimal.43
Convert each binary number to decimal.11011
Convert the hexadecimal number to decimal.9D
Convert each binary number to decimal. 10110
Convert the hexadecimal number to decimal.392
Convert each binary number to decimal. 111011
Convert the hexadecimal number to decimal.4C5
Convert each binary number to decimal. 101010
Convert the hexadecimal number to decimal.82F4
Convert each binary number to decimal.1101001
Convert the hexadecimal number to decimal.E533
Convert each binary number to decimal. 10011101
Convert the decimal number to hexadecimal.75
Showing 1 - 100
of 9193
1
2
3
4
5
6
7
8
9
10
11
12
13
14
15
Last