New Semester
Started
Get
50% OFF
Study Help!
--h --m --s
Claim Now
Question Answers
Textbooks
Find textbooks, questions and answers
Oops, something went wrong!
Change your search query and then try again
S
Books
FREE
Study Help
Expert Questions
Accounting
General Management
Mathematics
Finance
Organizational Behaviour
Law
Physics
Operating System
Management Leadership
Sociology
Programming
Marketing
Database
Computer Network
Economics
Textbooks Solutions
Accounting
Managerial Accounting
Management Leadership
Cost Accounting
Statistics
Business Law
Corporate Finance
Finance
Economics
Auditing
Tutors
Online Tutors
Find a Tutor
Hire a Tutor
Become a Tutor
AI Tutor
AI Study Planner
NEW
Sell Books
Search
Search
Sign In
Register
study help
mathematics
basic technical mathematics
Basic Technical Mathematics 12th Edition Allyn J. Washington, Richard Evans - Solutions
Convert each decimal number to binary.7
Convert the decimal number to hexadecimal.425
Convert each decimal number to binary.18
Convert the decimal number to hexadecimal.386
Convert each decimal number to binary.27
Convert the decimal number to hexadecimal.1259
Convert each decimal number to binary.39
Convert the decimal number to hexadecimal.1502
Convert the decimal number to hexadecimal.7239
Convert each decimal number to binary.80
Convert the decimal number to hexadecimal.8417
Convert each decimal number to binary.152
Convert the decimal number to hexadecimal.12,722
Convert each decimal number to binary.185
Add the hexadecimal numbers.4F + 81
Add the binary numbers.110 + 101
Add the hexadecimal numbers.75 + B9
Add the binary numbers.1011 + 1110
Add the hexadecimal numbers.26 + 29
Add the binary numbers.10011 + 11010
Add the hexadecimal numbers.49 + AD
Add the binary numbers.101101 + 110011
Add the hexadecimal numbers.3C4 + 295
Add the binary numbers.111001 + 10110
Add the binary numbers.100111 + 101011
Add the hexadecimal numbers.A59 + 2F3
Add the binary numbers.101 + 100 + 110
Add the hexadecimal numbers.6289 + 41D8
Add the binary numbers.1110 + 1101 + 101
Add the hexadecimal numbers.1F2A + 32B1
Subtract the binary numbers.1001 − 101
Subtract the hexadecimal numbers.9E − 7D
Subtract the binary numbers.1110 − 1011
Subtract the hexadecimal numbers.F9 − A4
Subtract the binary numbers.10011 − 1110
Subtract the hexadecimal numbers.B3 − 95
Subtract the binary numbers.11001 − 10111
Subtract the hexadecimal numbers.85 − 2F
Subtract the binary numbers.101010 − 100111
Subtract the hexadecimal numbers.67A − 3B2
Subtract the binary numbers.100001 − 11010
Subtract the hexadecimal numbers.C44 − 19
Subtract the binary numbers.1100011 − 1011101
Subtract the hexadecimal numbers.56E8 − 2AA
Subtract the binary numbers.11110010 − 10101100
Subtract the hexadecimal numbers.B9E4 − 625C
Convert the given binary number to hexadecimal.0101 1110
The ASCII code assigns a decimal number between 0 and 127 for each character on a computer keyboard. When a key is pressed, the computer converts the character to an 8-bit binary number. For example, the ASCII code for the character “A” is 65, so the computer converts the letter “A” to the
Convert the given binary number to hexadecimal.0011 0111
The ASCII code assigns a decimal number between 0 and 127 for each character on a computer keyboard. When a key is pressed, the computer converts the character to an 8-bit binary number. For example, the ASCII code for the character “A” is 65, so the computer converts the letter “A” to the
Convert the given binary number to hexadecimal.1000 0101
Convert the given binary number to hexadecimal.1111 1111
Convert the given binary number to hexadecimal.1000 0001
In Example 2, change the first
Convert the given hexadecimal number to binary.7B
Convert the given hexadecimal number to binary.F2
Convert the given hexadecimal number to binary.49
Convert the given hexadecimal number to binary.BA
Convert the given hexadecimal number to binary.C8
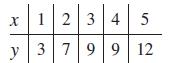
Find the equation of the least-squares line for the given data. Graph the line and data points on the same graph. X У 1 2 3 4 5 3 799 9 12
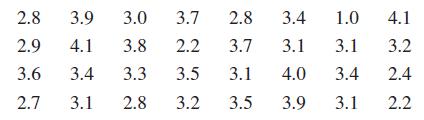
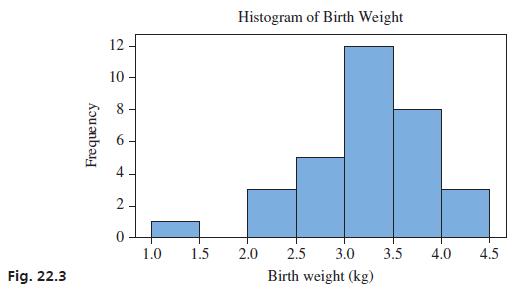
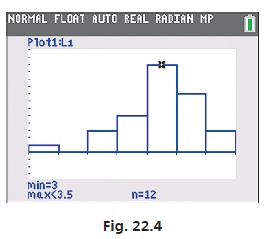
In Example 3, change the class limits to 1.0, 2.0, 3.0, 4.0, and 5.0 and then make a table showing the frequencies and relative frequencies.Data from Example 3The birth weights (in kg) for a sample of 32 infants are given below. Make a histogram of these data.We will begin by making a frequency
Convert the given hexadecimal number to binary.D5
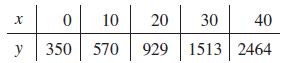
Find an exponential regression model for the given data: y 0 10 20 30 40 350 570 929 1513 2464
The ASCII code assigns a decimal number between 0 and 127 for each character on a computer keyboard. When a key is pressed, the computer converts the character to an 8-bit binary number. For example, the ASCII code for the character “A” is 65, so the computer converts the letter “A” to the
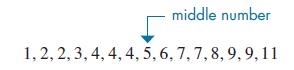
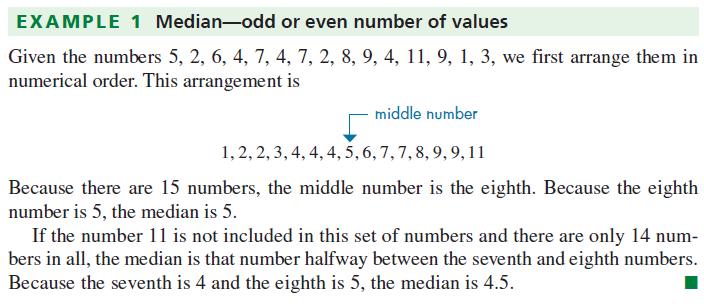
Delete the 5 from the data numbers given for Example 1 and then do the following with the resulting data.Find the median.Data from Example 1Given the numbers 5, 2, 6, 4, 7, 4, 7, 2, 8, 9, 4, 11, 9, 1, 3, we first arrange them in numerical order. This arrangement isBecause there are 15 numbers, the
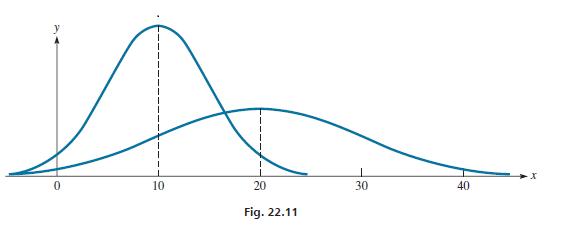
In Example 1, change the second from 10 to 5 and then describe the curve that would result in terms of either or both curves shown in Fig. 22.11.Data from Example 1In Fig. 22.11, for the left curve, μ = 10 and σ = 5, whereas for the right curve, μ = 20 and σ = 10. A 10 0 20 Fig. 22.11 30 40
The ASCII code assigns a decimal number between 0 and 127 for each character on a computer keyboard. When a key is pressed, the computer converts the character to an 8-bit binary number. For example, the ASCII code for the character “A” is 65, so the computer converts the letter “A” to the
The ASCII code assigns a decimal number between 0 and 127 for each character on a computer keyboard. When a key is pressed, the computer converts the character to an 8-bit binary number. For example, the ASCII code for the character “A” is 65, so the computer converts the letter “A” to the
The ASCII code assigns a decimal number between 0 and 127 for each character on a computer keyboard. When a key is pressed, the computer converts the character to an 8-bit binary number. For example, the ASCII code for the character “A” is 65, so the computer converts the letter “A” to the
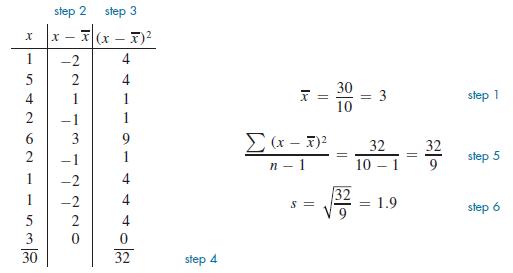
Find s from the definition given by Eq. (22.2), as in Example 1.Data from Example 1Find the standard deviation of the following numbers: 1, 5, 4, 2, 6, 2, 1, 1, 5, 3. A table of the necessary values is shown below, and steps 1–6 are indicated:Eq. 22.2 X 1542 62 2 -1 3 -1 1 1 step 2 step 3 x-x(x -
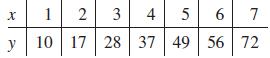
Find the equation of the least-squares line for the given data. Graph the line and data points on the same graph. X 1 y 2 3 4 5 6 7 10 17 28 37 49 56 72
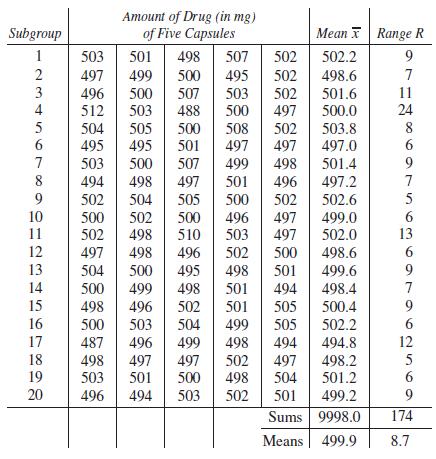
In Example 2, change the first subgroup to 497, 499, 502, 493, and 498 and then proceed as directed.Find LCL (R) and UCL (R).Data from Example 2A pharmaceutical company makes a capsule of a prescription drug that contains 500 mg of the drug, according to the label. In a newly modified process of
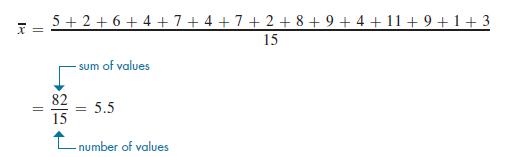
Delete the 5 from the data numbers given for Example 1 and then do the following with the resulting data.Find the mean using the definition, as in Example 3.Data from Example 3The mean of the numbers given in Example 1 is determined by finding the sum of all the numbers and dividing by 15.
Of the 32 injuries that happened at a factory in a certain year, 14 were hand injuries, 8 were back injuries, 6 were eye injuries, and 4 were other injuries. Make a bar graph of these data.
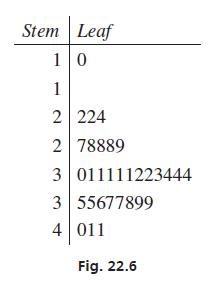
In Example 4, change the lowest data value from 1.0 to 0.9 and then make a stem-and-leaf plot with split stems.Data from Example 4In a stem-and-leaf plot, all but the last digit of each data value is called the stem and the last digit is the leaf. The stems are listed vertically with a line
Determine each of the following as being either true or false. If it is false, explain why.If the raw data includes 25 values, and a class includes 3 of these values, the relative frequency of this class is 12%.
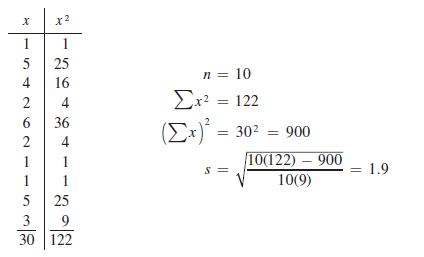
Find s using Eq. (22.3), as in Example 2.Data from Example 2Using Eq. (22.3), find s for the numbers in Example 1.Eq. 22.3 X 1 5 4 2 6 2 1 5 Μ 3 30 r² x² 1 25 16 4 36 4 1 1 25 9 122 n = 10 Σχε = 122 (2x) = 302 = 900 S= 10(122) - 900 10(9) 1.9
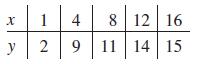
Find a logarithmic regression model for the given data: X 1 4 8 12 16 y 2 9 11 14 15
In Example 2, what percentage of the test scores are between 350 and 650?Data from Example 2The scores on a certain achievement test are normally distributed with a mean of 500 and a standard deviation of 50. What percentage of the scores are (a) between 400 and 600, and (b) higher than 550?(a)
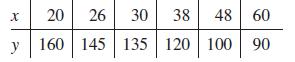
Find the equation of the least-squares line for the given data. Graph the line and data points on the same graph. 20 26 30 38 48 60 y 160 145 135 120 100 90 X
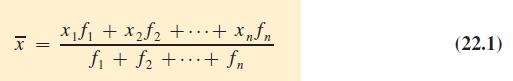
Delete the 5 from the data numbers given for Example 1 and then do the following with the resulting data. Find the mean using Eq. (22.1), as in Example 4. Data from In Example 1 Data from In Example 4 Using Eq. (22.1) to find the mean of the numbers of Example 1, we first set up a table of values
In Example 3, find and interpret the z-score of an achievement test score of 630.Data from Example 3Using the mean and standard deviation given in Example 2, find and interpret the z-scores of achievement test results of (a) 610 and (b) 435.(a) The test result of 610 has a z-score ofThis test
Use the following set of numbers.5, 6, 1, 4, 9, 5, 7, 3, 8,10, 5, 8, 4, 9, 6Find the median
Determine each of the following as being either true or false. If it is false, explain why.The mean of the numbers 2, 3, 6, 4, 5 is 4.
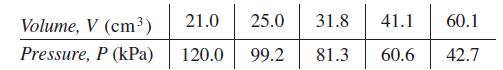
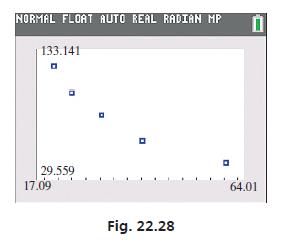
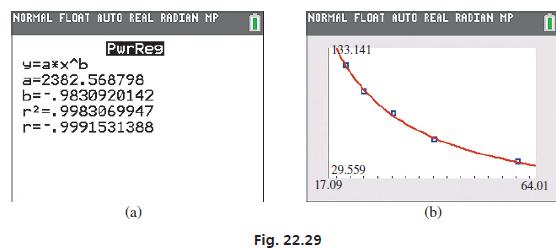
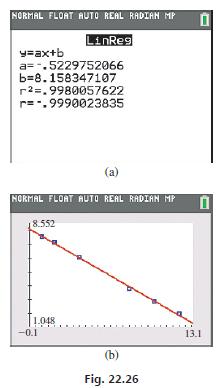
Use a calculator to find a regression model for the given data. Graph the scatterplot and regression model on the calculator. Use the regression model to make the indicated predictions.In Example 1, change the V (volume of the gas) values to 19.9, 24.5, 29.4, 39.4, 56.0. Then find a power
In Example 2, change the first subgroup to 497, 499, 502, 493, and 498 and then proceed as directed.How would the x̄ control chart differ from the top graph in Fig. 22.20?Data from Example 2A pharmaceutical company makes a capsule of a prescription drug that contains 500 mg of the drug, according
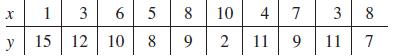
Find the equation of the least-squares line for the given data. Graph the line and data points on the same graph. X y 1 3 65 8 10 15 12 10 8 9 4 7 38 2 11 9 11 7
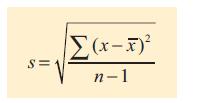
Use Eq. (22.2) to find the standard deviation s for the indicated sets of numbers.Set AA: 3, 6, 4, 2, 5, 4, 7, 6, 3, 4, 6, 4, 5, 7, 3Eq. 22.2 S= Σ(x-5) I-u
Use Eq. (22.2) to find the standard deviation s for the indicated sets of numbers.Eq. 22.2Set BB: 25, 26, 23, 24, 25, 28, 26, 27, 23, 28, 25 S= Σ(x-5) I-u
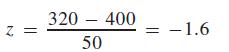
In Example 5(b), change 320 to 360 and then find the resulting percentage of batteries.Data from Example 5(b)(b) We begin by finding the z-score of 320 days:We wish to find the area to the right of z = −1.6, shown in Fig. 22.16. The area between z = 0 and z = −1.6 is 0.4452. Since the area to
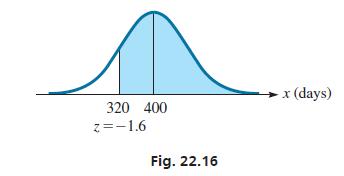
The following data show the tensile strength (in 105 lb/in.2) of brass (a copper-zinc alloy) that contains different percent of zinc.Find a logistic regression model for the data. Predict the tensile strength of brass that contains 25% zinc. Percent of Zinc Tensile Strength 0 5 10 15 20 30 0.32
Use the following set of numbers.5, 6, 1, 4, 9, 5, 7, 3, 8,10, 5, 8, 4, 9, 6Find the mode.
Determine each of the following as being either true or false. If it is false, explain why.The standard deviation of the numbers 2, 3, 6, 4, 5 is √5/2.
In Example 2, change the first subgroup to 497, 499, 502, 493, and 498 and then proceed as directed.How would the R control chart differ from the bottom graph in Fig. 22.20?Data from Example 2A pharmaceutical company makes a capsule of a prescription drug that contains 500 mg of the drug, according
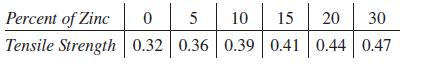
In Example 4, change the y (mg of drug/dL of blood) values to 8.7, 8.4, 7.7, 7.3, 5.7, 5.2. Then proceed to find y as a function of t, as in Example 4.Data from Example 4In a research project to determine the amount of a drug that remains in the bloodstream after a given dosage, the amounts y (in
Delete the 5 from the data numbers given for Example 1 and then do the following with the resulting data. Find the mode, as in Example 7. Data from in Example 1 Data from in Example 7 (a) The mode of the numbers in Example 1 is 4, since it appears three times and no other value appears more than
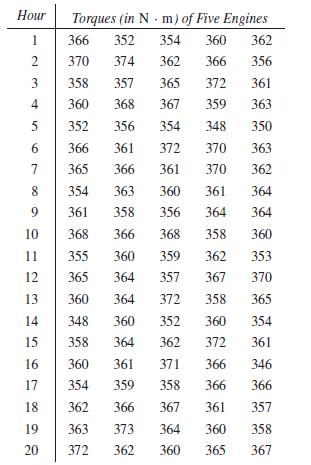
Five automobile engines are taken from the production line each hour and tested for their torque (in N · m) when rotating at a constant frequency. The measurements of the sample torques for 20 h of testing are as follows:Find the central line, UCL, and LCL for the mean.
Use Eq. (22.2) to find the standard deviation s for the indicated sets of numbers.Eq. 22.2Set CC: 0.48, 0.53, 0.49, 0.45, 0.55, 0.49, 0.47, 0.55, 0.48, 0.57, 0.51, 0.46, 0.53, 0.50, 0.49, 0.53 S= Σ(x-5) I-u
Indicate whether the variable is qualitative or quantitative.A person’s favorite genre of music
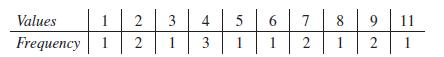
Use the following set of numbers.5, 6, 1, 4, 9, 5, 7, 3, 8,10, 5, 8, 4, 9, 6Draw a histogram using class limits of 1, 3, 5, . . . , 11.
Showing 100 - 200
of 9193
1
2
3
4
5
6
7
8
9
10
11
12
13
14
15
Last
Step by Step Answers