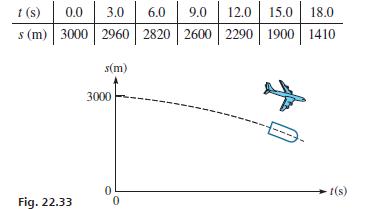
All Matches
Solution Library
Expert Answer
Textbooks
Search Textbook questions, tutors and Books
Oops, something went wrong!
Change your search query and then try again
Toggle navigation
FREE Trial
S
Books
FREE
Tutors
Study Help
Expert Questions
Accounting
General Management
Mathematics
Finance
Organizational Behaviour
Law
Physics
Operating System
Management Leadership
Sociology
Programming
Marketing
Database
Computer Network
Economics
Textbooks Solutions
Accounting
Managerial Accounting
Management Leadership
Cost Accounting
Statistics
Business Law
Corporate Finance
Finance
Economics
Auditing
Ask a Question
AI Study Help
New
Search
Search
Sign In
Register
study help
mathematics
basic technical mathematics
Questions and Answers of
Basic Technical Mathematics
Display the graphs of the given functions on a graphing calculator. Use appropriate window settings.y = 8 − 2x2
Represent the data graphically.A changing electric current in a coil of wire will induce a voltage in a nearby coil. Important in the design of transformers, the effect is called mutual inductance.
Graph the given functions.y = −2x
Represent the data graphically.An oil burner propels air that has been heated to 90°C. The temperature then drops as the distance from the burner increases, as shown in the following table: Distance
Solve the given problems related to the indicated examples of this sectionIn Example 7, interchange 40% and 20% and then find the function.Data from Example 7A metallurgist melts and mixes m grams
Find the domain and range of the given functionsf(x) = x + 5
Plot the given pointsA(2, 7), B( 1, 2),C(4, 2), D(0, 4)
Make the given changes in the indicated examples of this section and then plot the graphs.In Example 5, change the + sign to −.Data from Example 5Graph the functionWhen finding the points for the
Determine each of the following as being either true or false. If it is false, explain why.If (2, 0) is an x-intercept of the graph of y = f(x), then (2, 0) is also an intercept of the graph of y = 2
Determine (at least approximately) the coordinates of the points shown in Fig. 3.13.D, E, F -5 E 5 B Co 0 -5 F A D Fig. 3.13 5 ·x
Display the graphs of the given functions on a graphing calculator. Use appropriate window settings.y = x2 − 4x
Graph the given functions.y = 3x
Find the indicated functions.Express the area A of a circle as a function of (a) Its radius r and(b) Its diameter d.
Use a graphing calculator to solve the equation 2x2 − 3 = 3x to the nearest 0.1.
In Example 8, change x2 − 3x to x3 + 4x and then determine the statements that should be placed in the three boxes in Fig. 3.3.Data from Example 8The function f(x) = x2 − 3x tells us to “square
Represent the data graphically.The amount of material necessary to make a cylindrical gallon container depends on the diameter, as shown in this table: Diameter (in.) Material (in.²) 3.0 4.0 5.0
Solve the given problems related to the indicated examples of this section.In Example 5, find f(2) and f(5).Data from Example 5In a certain electric circuit, the current i (in mA) is a function of
Determine each of the following as being either true or false. If it is false, explain why.If y2 = x, then y is a function of x.
Display the graphs of the given functions on a graphing calculator. Use appropriate window settings.y = 4 − 0.5x
Represent the data graphicallyThe average exchange rate for the number of Canadian dollars equal to one U.S. dollar for 2014–2020 is as follows: Year Can. Dol. 2014 2015 2016 2017 2018 2019
Plot the graph of the function f(x) = 4 − 2x.
Solve the given problems related to the indicated examples of this section.In Example 6, change “increased” to “decreased” in the second and third lines and then evaluate the function to find
Solve the given problems related to the indicated examples of this section.In Example 3, in the first line, changeWhat other changes must be made in the first paragraph?Data from Example 3Find the
Make the given changes in the indicated examples of this section and then plot the graphs.In Example 4, change the x in the denominator to x − 1.Data from Example 4Graph the functionIn finding the
Determine each of the following as being either true or false. If it is false, explain why.All points for which y > 1 are in quadrants I and IV.
In Example 8, in the second line, change “to the right 3 units and down 2 units” to “to the left 2 units and down 3 units.”Data from Example 8Use the vertical line test to determine whether
Display the graphs of the given functions on a graphing calculator. Use appropriate window settings.y = 3x − 1
Make the given changes in the indicated examples of this section and then plot the graphs.In Example 2, change 2x2 − 4 to 4 − 2x2.Data from Example 2Graph the function f (x) = 2x2 − 4.First,
A rocket has a mass of 2000 Mg at liftoff. If the first-stage engines burn fuel at the rate of 10 Mg/s, find the mass m of the rocket as a function of the time t(in s) while the first-stage engines
Givenfind (a) f (−4) and (b) f (x − 4). 8 f(x) = - 2x²,
Solve the given problems related to the indicated examples of this section.In Example 5, evaluate g(−a2).Data from Example 5If thenIf F(y) = 5 - 4y2, then F(a + 1) = 5 - 4(a + 1)2
Solve the given problems related to the indicated examples of this section.In Example 1, in the first line, change x2 to −x2. What other changes must be made in the rest of the paragraph?Data from
Make the given changes in the indicated examples of this section, and then solve the resulting problems.In Example 2, change A(−3,−2) to A(0,−2) and then find the fourth vertex.Data from
The average monthly temperatures (in °C) for Washington, D.C., are as follows: Month Temp. (°C) J F M A M J JASON D 6 6 7 12 18 24 28 31 29 26 19 13 7
Determine each of the following as being either true or false. If it is false, explain why.The domain of f(x) = √x − 1 is all real numbers x > 1.
Determine each of the following as being either true or false. If it is false, explain why.f (−x) = −f(x) for any function f(x).
In Example 3, change the sign on the left side of the equation from − to +.Data from Example 3Using a calculator, graphically solve the equation x2 − 2x = 1.Following the above procedure, we
Solve the given problems related to the indicated examples of this section.In Example 4, find the value of f (−2).Data from Example 4For a function f(x), the value of f(x) for x = 2 may be
Make the given changes in the indicated examples of this section and then plot the graphs. In Example 1, change the − sign to +. Data from Example 1 Graph the function f (x) = 3x − 5.For
Make the given changes in the indicated examples of this section, and then solve the resulting problems.In Example 3(b), change y < 0 to y > 0 and then find the location of the points (x,
Find the third side of the right triangle shown in Fig. 2.42 for the given values.a = 3 in., b = 4 in. C b Fig. 2.42 a
Find the area of each figure.Trapezoid in Fig. 2.64 272 cm 392 cm 201 cm 672 cm Fig. 2.64 223 cm
Find the measures of the angles in Fig. 2.13.∠2 A C- 1 5 62° 6 AB || CD 3 Fig. 2.13 B D
Calculate the area of the circle by the indicated method.The lengths of parallel chords of a circle that are 0.250 in. apart are given in the following table. The diameter of the circle is 2.000 in.
Refer to Fig. 2.86, where AB is a diameter, TB is a tangent line at B, and ∠ABC = 65°. Determine the indicated angles.∠BCT Fig. 2.86 A 0 B с T
Set up a formula for the indicated perimeter or area.The perimeter of the figure in Fig. 2.65 (a parallelogram and a square attached) b Fig. 2.65 a
Find the measures of the angles in Fig. 2.13.∠3 A C- 1 5 62° 6 AB || CD 3 Fig. 2.13 B D
Calculate the area of the circle by the indicated method.The lengths of parallel chords of a circle that are 0.250 in. apart are given in the following table. The diameter of the circle is 2.000 in.
Find the perimeter of each triangle.Isosceles triangle, equal sides of 2.45 in., third side of 3.22 in.
Refer to Fig. 2.86, where AB is a diameter, TB is a tangent line at B, and ∠ABC = 65°. Determine the indicated angles.∠CAB Fig. 2.86 A 0 B с T
Find the third side of the right triangle shown in Fig. 2.42 for the given values.a = 5 yd, c = 13 yd C b Fig. 2.42 a
Find the perimeter or area of the indicated figure.Area: triangle: b = 0.125 ft, h = 0.188 ft
Refer to Fig. 2.86, where AB is a diameter, TB is a tangent line at B, and ∠ABC = 65°. Determine the indicated angles.∠BTC Fig. 2.86 A 0 B с T
Find the volume or area of each solid figure for the given values.Total surface area of right circular cone: r = 3.39 cm, h = 0.274 cm r = 3.39 cm, h = 0.274 cm
Find the measures of the angles in Fig. 2.13.∠4 A C- 1 5 62° 6 AB || CD 3 Fig. 2.13 B D
Set up a formula for the indicated perimeter or areaThe perimeter of the figure in Fig. 2.66 (two trapezoids attached) a b a Fig. 2.66 b
Calculate the area of the circle by the indicated method.The lengths of parallel chords of a circle that are 0.250 in. apart are given in the following table. The diameter of the circle is 2.000 in.
Find the perimeter or area of the indicated figure.Area: triangle of sides 175 cm, 138 cm, 119 cm
Find the volume or area of each solid figure for the given values.Total surface area of regular pyramid: All faces and base are equilateral triangles of side 3.67 in.
Solve the given problems.Equation (2.28) expresses the volume V of a sphere in terms of the radius r. Express V in terms of the diameter d.Equation(2.28) V = 4 3 πr 3
Find the measures of the angles in Fig. 2.13.∠5 A C- 1 5 62° 6 AB || CD 3 Fig. 2.13 B D
Set up a formula for the indicated perimeter or areaArea of figure in Fig. 2.65 h b Fig. 2.65 a
Find the third side of the right triangle shown in Fig. 2.42 for the given values.a = 13.8ft, b = 22.7ft C b Fig. 2.42 a
Refer to Fig. 2.87. Determine the indicated arcs and angles.Fig.2.87 BC
Set up a formula for the indicated perimeter or areaArea of figure in Fig. 2.66 a b a Fig. 2.66 b
Find the perimeter or area of the indicated figure.Circumference of circle: d = 74.8 mm
Refer to Fig. 2.87. Determine the indicated arcs and angles.Fig.2.87 AB
Find the third side of the right triangle shown in Fig. 2.42 for the given values.a = 2.48m, b = 1.45m C b Fig. 2.42 a
Find the measures of the angles in Fig. 2.13.∠6 A C- 1 5 62° 6 AB || CD 3 Fig. 2.13 B D
Find the perimeter or area of the indicated figure.Perimeter: rectangle, l = 2980 yd, w = 1860 yd
Solve the given problems.Derive a formula for the total surface area A of a hemispherical volume of radius r (curved surface and flat surface).
Find the perimeter or area of the indicated figure.Area: trapezoid, b1 = 67.2 in., b2 =126.7 in., h = 34.2 in.
Solve the given problems.The radius of a cylinder is twice as long as the radius of a cone, and the height of the cylinder is half as long as the height of the cone. What is the ratio of the volume
Solve the given problems.If the angle between adjacent sides of a parallelogram is 90°, what conclusion can you make about the parallelogram?
Use Fig. 2.131. Determine the indicated angles.∠DGHFig. 2.131. ABICD C A 148⁰ E I H G F D B
Find the measures of the indicated angles.∠AOB C F 50° 0 E Fig. 2.11 B D
Find the indicated sides of the right triangle shown in Fig. 2.132.b = 5600, c = 6500, a = ? a C b Fig. 2.132
The width of a marshy area is measured at 50-ft intervals, with the results shown in the following table. Using the trapezoidal rule, find the area of the marsh. (All data accurate to two or more
Calculate the indicated areas. All data are accurate to at least two significant digits.A cartographer measured the width of Bruce Peninsula in Ontario at 10-mm intervals on a map (scale 10 mm = 23
Calculate the indicated areas. All data are accurate to at least two significant digits.The widths (in m) of half the central arena in the Colosseum in Rome are shown in the following table, starting
Find the area of each triangle.Right triangle with legs 3.46 ft and 2.55 ft
Find the indicated sides of the right triangle shown in Fig. 2.132.b = 0.380, c = 0.736, a = ? a C b Fig. 2.132
Find the measures of the indicated angles.∠AOC C. A F 50° 0 E Fig. 2.11 B D
Find the volume or area of each solid figure for the given values.Volume of right prism: square base of side 29.0 cm, h = 11.2 cm
Find the area of each figure.Square: s = 15.6 ft
Find the area of the circle with the given radius or diameter.r = 45.8 cm
Find the area of each triangle.Right triangle with legs 234 mm and 342 mm
Find the indicated sides of the right triangle shown in Fig. 2.132.b = 25.1, c = 128, a = ? a C b Fig. 2.132
Find the measures of the indicated angles.∠BOD C. A F 50° 0 E Fig. 2.11 B D
Calculate the indicated areas. All data are accurate to at least two significant digits.The widths of the baseball playing area in Boston’s Fenway Park at 45-ft intervals are shown in Fig. 2.110.
Find the volume or area of each solid figure for the given values.Volume of frustum of right circular cone: R = 37.3 mm, r = 28.2 mm, h = 45.1 mm
Find the measures of the indicated angles use Fig. 2.12.∠3 21 = 22 150° 3 2, Fig. 2.12 5
Find the area of each figure.Rectangle: l = 8.35 in., w = 2.81 in.
Calculate the indicated areas. All data are accurate to at least two significant digits.Find the playing area of Fenway Park (see Exercise 15) by Simpson’s rule.Data from Exercises 15The widths of
Find the area of the circle with the given radius or diameter.d = 2.33 m
Find the area of each triangle.Isosceles triangle, equal sides of 0.986 m, third side of 0.884 m
Find the volume or area of each solid figure for the given values.Lateral area of frustum of right circular cone: R = 3.42 m, r = 2.69 m, s = 3.25 m
Find the indicated sides of the right triangle shown in Fig. 2.132.b = 38.3, c = 52.9, a = ? a C b Fig. 2.132
Find the area of each figure.Rectangle: l = 142 cm,w = 126 cm
Find the area of the circle with the given radius or diameter.d = 1256 ft
Showing 7900 - 8000
of 9193
First
73
74
75
76
77
78
79
80
81
82
83
84
85
86
87
Last