

Question: Genders of students. The stack plot in Figure 21 shows the numbers of male and female higher education students for different years. Projections are from
Genders of students. The stack plot in Figure 21 shows the numbers of male and female higher education students for different years. Projections are from the U.S. National Center for Education Statistics.
a. In words, discuss the trends revealed on this graphic.
b. Redraw the graph as a multiple line chart. Briefly discuss the advantages and disadvantages of the two different representations of this particular data set.
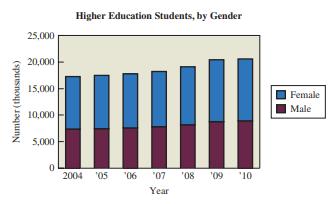
Number (thousands) 25,000 20,000 15,000 10,000 5,000 Higher Education Students, by Gender 0 2004 '05 '06 '07 '08 '09 '10 Year Female Male
Step by Step Solution
There are 3 Steps involved in it
1 Expert Approved Answer
Step: 1 Unlock

Question Has Been Solved by an Expert!
Get step-by-step solutions from verified subject matter experts
Step: 2 Unlock
Step: 3 Unlock