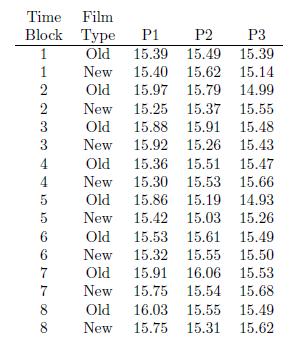
5. Ramirez and Tobias (2007) present the data shown below from an experi- ment to compare performance,
Question:
5. Ramirez and Tobias (2007) present the data shown below from an experi-
ment to compare performance, based on a quality characteristic, of a new and old lm type and three manufacturing pressures. One lm type was

selected at random and it was run through the manufacturing process ran-
domly assigning each pressure to 1 3 rd of the roll. Quality measurements were made on each third of the roll. Next, the other lm type was run through the process again randomly assigning each pressure to 1 3 rd of the roll. This two-step experimental process was repeated eight dierent times.
(a) Was this a completely randomized or randomized block design in the whole plots?
(b) What is the model for the data?
(c) Analyze the data to determine if type or pressure have any eect on the quality characteristic measured.
(d) Describe any signicant dierences you nd and interpret what these dierences mean by referring to tables or graphs of means or multiple comparison tests.
(e) Check the assumptions of equal variance and normality of the whole-plot and split-plot error terms as described in Section 5.9.
Step by Step Answer:


