

The diagram shows the graph of f(x). The points A(4, 3) and B(9, 3) are turning points
Question:
The diagram shows the graph of f(x). The points A(4, −3) and B(9, 3) are turning points on the graph
Sketch on separate diagrams, the graphs of
a. y = f(2x) + 1
b. y = |f(x)|
c. y = −f(x − 2)
Indicate on each diagram the coordinates of any turning points on your sketch.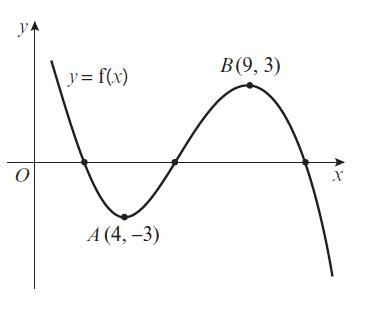
Fantastic news! We've Found the answer you've been seeking!
Step by Step Answer:
B YA 0 YA ...View the full answer

Answered By
Ehsan Mahmood
I’ve earned Masters Degree in Business Studies and specialized in Accounts & Finance. Couple with this, I have earned BS Sociology from renowned institute of Pakistan. Moreover, I have humongous teaching experience at Graduate and Post-graduate level to Business and humanities students along with more than 7 years of teaching experience to my foreign students Online. I’m also professional writer and write for numerous academic journals pertaining to educational institutes periodically.
248+ Reviews
287+ Question Solved
Related Book For 

Pearson Edexcel A Level Mathematics Pure Mathematics Year 2
ISBN: 9781292183404
1st Edition
Authors: Greg Attwood, Jack Barraclough, Ian Bettison, David Goldberg, Alistair Macpherson, Joe Petran
Question Posted:
