

Question: When vibrational transitions are observed in an electronic absorption spectrum, these transitions can be used to determine dissociation energies. Specifically, a BirgeSponer plot is constructed
When vibrational transitions are observed in an electronic absorption spectrum, these transitions can be used to determine dissociation energies. Specifically, a Birge€“Sponer plot is constructed where the energy difference between successive vibrational transitions n and n + 1 (ΔGn+1/2) (see figure) is plotted versus the vibrational level number. Note that G does not refer to the Gibbs energy in this context.
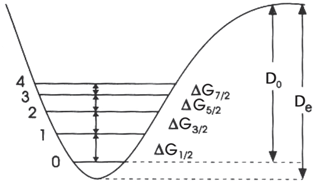
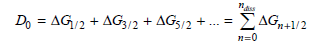
The central idea behind the approach is that the dissociation energy is equal to the sum of these energy differences from n = 0 to the dissociation limit:
a. For the ground state of I2 the following values for ΔG versus n were determined (J. Chem. Phys. 32 (1960): 738.
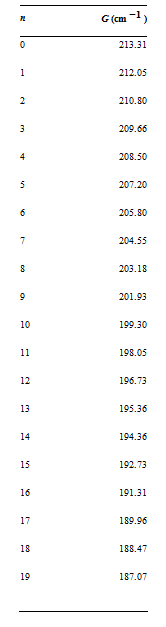
If the potential function can be described by a Morse potential [Equation (19.5)], ΔG will be a linear function of n + 1/2. Construct a Birge€“Sponer plot (ΔG versus n + 1/2) using the given data, and, using the best fit to a straight line, to determine the value of n where ΔG = 0. This is the I2 ground-state vibrational quantum number at dissociation.
b. The area under the Birge€“Sponer plot is equal to the dissociation energy, D0. This area can be determined by summing the ΔG values from n = 0 to n at dissociation [determined in part (a)]. Perform this summation to determine D0 for ground state I2. You can also integrate the best fit equation to determine D0.
D. De AG12 AG512 AG312 AG12 D-G/2 + G/2+G5/2 G+1/2 n=0
Step by Step Solution
3.53 Rating (163 Votes )
There are 3 Steps involved in it
a The plot of G versus n 12 with best fit to a straight line is given below Using the expression ... View full answer

Get step-by-step solutions from verified subject matter experts