Question: a. Calculate and graph the hydrogen radial wave function R 2p (r) over the interval 0 r 8a B . b. Determine the
a. Calculate and graph the hydrogen radial wave function R2p(r) over the interval 0 ≤ r ≤ 8aB.
b. Determine the value of r (in terms of aB) for which R2p(r) is a maximum.
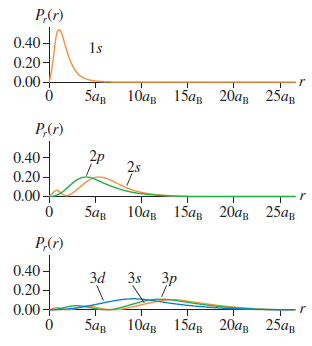
c. Example 41.3 and Figure 41.7 showed that the radial probability density for the 2p state is a maximum at r = 4aB. Explain why this differs from your answer to part b.
Figure 41.7

Step by Step Solution
There are 3 Steps involved in it
Solve a From Equation 417 the 2p radial wave function is The graph of R 2p r is seen to have a singl... View full answer

Get step-by-step solutions from verified subject matter experts


