

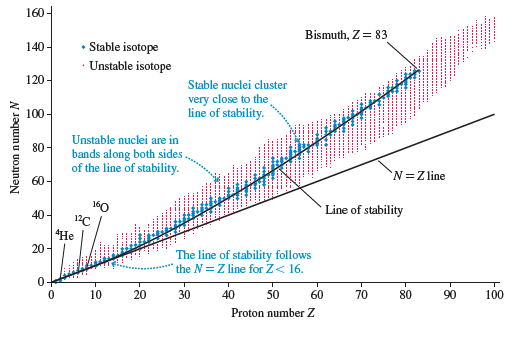
Question: Use data in Appendix C to make your own chart of stable and unstable nuclei, similar to Figure 42.4, for all nuclei with Z
Use data in Appendix C to make your own chart of stable and unstable nuclei, similar to Figure 42.4, for all nuclei with Z ≤ 8. Use a blue or black dot to represent stable isotopes, a red dot to represent isotopes that undergo beta-minus decay, and a green dot to represent isotopes that undergo beta-plus decay or electron-capture decay.
Figure 42.4
Step by Step Solution
There are 3 Steps involved in it
1 Expert Approved Answer
Step: 1 Unlock

Solve The chart shows stable and unstable nuclei for a... View full answer
Question Has Been Solved by an Expert!
Get step-by-step solutions from verified subject matter experts
Step: 2 Unlock
Step: 3 Unlock