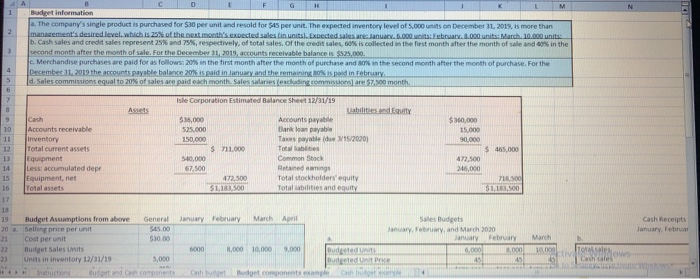
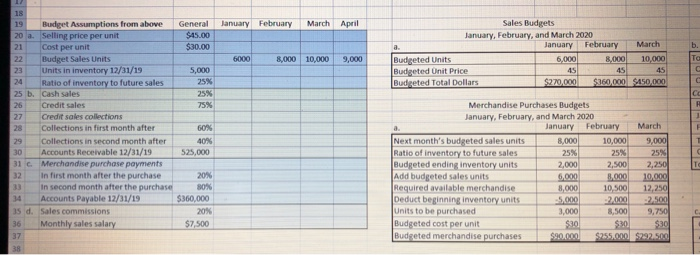
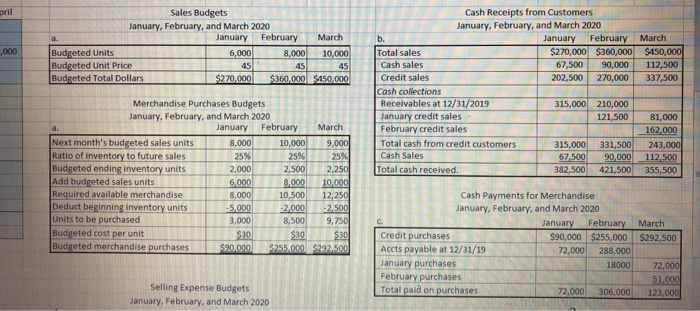
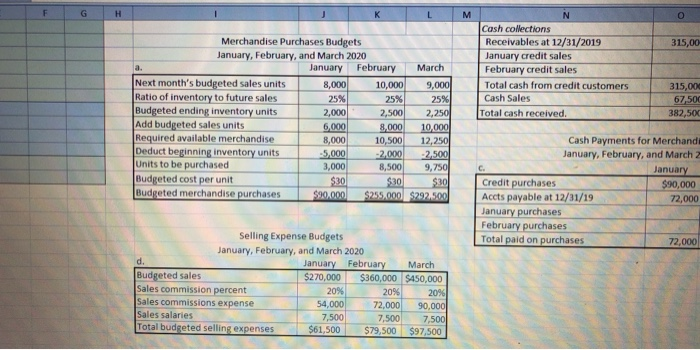
1 2 G Budget information a. The company's single product is purchased for 530 per unit and resold for $45 per unit. The expected inventory level of 5,000 units on December 31, 2019, is more than management's desired level which is 25 of the next month's expected sales in units. Expected sales are: January. 6.000 February. 3.000 units: March 10.000 units b. Cash sales and credit sales represent 25% and 75%, respectively, of total sales of the credit sales, 60% is collected in the first month after the month of sale and in the second month after the month of sale. For the December 31, 2019, accounts receivable balance is $525.000 c. Merchandise purchases are paid for as follows: 20% in the first month after the month of purchase and in the second month after the month of purchase. For the December 11, 2015 the accounts payable balance 20% is paid in January and the remaining in Teba d. Sales commissions equal to 20% of sales are paid each month. Sales salaries (excluding commission 57.500 month 2 4 5 $360,000 15.000 90,000 Isle Corporation Estimated Balance Sheet 12/31/19 abilities and Equity $35,000 Accounts payable 525.000 Bank loan payable 150,000 Taxes payable (de 3/15/2020) $ 711.000 Totables 540,000 Common Stock 67,500 Reedings 47200 Total stockholders' equity $1,183.500 Total abilities and equity $ 465,000 8 9 10 Accounts receivable Inventory Total current assets 13 Equipment 14 Less: accumulated depr 15 Equipment, net 16 Total assets 17 18 19 Budget Assumptions from above 20 Selling price per unit 21 Cost per unit 22 Budget Sales Units 23 Units in inventory 12/31/19 472.500 245,000 $1,103,500 General $45.00 S0.00 Cash Receipts January Februar January February March April Sales Budget January February, and March 2030 January February 6000 11,000 10,000 9.000 Budgeted 3,000 Budgeted unit Price 15 45 de components example March 10.000 w 5.000 Cash Sales January February March April General $45.00 $30.00 b 6000 Sales Budgets January, February, and March 2020 a. January February March Budgeted Units 6,000 8,000 10.000 Budgeted Unit Price 45 45 45 Budgeted Total Dollars $270,000 $360,000 $450,000 8,000 10,000 9,000 TO 5,000 25% 25% 75% 18 19 Budget Assumptions from above 20 a. Selling price per unit 21 Cost per unit 22 Budget Sales Units 23 Units in inventory 12/31/19 24 Ratio of inventory to future sales 25 b. Cash sales 26 Credit sales 27 Credit sales collections Collections in first month after 29 Collections in second month after 30 Accounts Receivable 12/31/19 31 c. Merchandise purchase payments 32 In first month after the purchase In second month after the purchase 14 Accounts Payable 12/31/19 35 d. Sales commissions 36 Monthly sales salary 37 38 60% 40% 525,000 TO 20% 80% $360,000 20% $7,500 Merchandise Purchases Budgets January, February, and March 2020 January February March Next month's budgeted sales units 8.000 10,000 9,000 Ratio of inventory to future sales 25% 25% 25% Budgeted ending inventory units 2,000 2.500 2,250 Add budgeted sales units 6.000 8.000 10.000 Required available merchandise 8,000 10,500 12,250 Deduct beginning inventory units 5.000 -2,000 -2.500 units to be purchased 3,000 8,500 9.750 Budgeted cost per unit $30 $30 $30 Budgeted merchandise purchases $90.000 $255.000 $292.500 pril Sales Budgets January, February, and March 2020 January February March Budgeted Units 6,000 8,000 10,000 Budgeted Unit Price 45 45 45 Budgeted Total Dollars $270,000 $360,000 SASO,000 4,000 Cash Receipts from Customers January, February, and March 2020 b. January February March Total sales $270,000 $360,000 $450,000 Cash sales 67,500 90,000 112,500 Credit sales 202,500 270,000 337,500 Cash collections Receivables at 12/31/2019 315,000 210,000 January credit sales 121,500 81,000 February credit sales 162.000 Total cash from credit customers 315,000 331,500 243,000 Cash Sales 67,500 90,000 112,500 Total cash received. 382,500 421,500 355,500 25% Merchandise Purchases Budgets January, February, and March 2020 a. January February March Next month's budgeted sales units 8,000 10,000 9,000 Ratio of inventory to future sales 25% 25% Budgeted ending inventory units 2,000 2,500 2,250 Add budgeted sales units 6.000 8.000 10,000 Required available merchandise 8,000 10,500 12,250 Deduct beginning inventory units -5,000 -2,000 -2.500 Units to be purchased 3,000 8,500 9,750 Budgeted cost per unit $30 $30 $30 Budgeted merchandise purchases $90.000 $255.000 $292.500 C. March $292,500 Cash Payments for Merchandise January, February, and March 2020 January February Credit purchases $90,000 $255,000 Accts payable at 12/31/19 72,000 288,000 January purchases 18000 February purchases Total paid on purchases 72,000 306,000 72,000 51.000 123,000 Selling Expense Budgets January, February, and March 2020 F G H K L M 315,00 a. Merchandise Purchases Budgets January, February, and March 2020 January February March Next month's budgeted sales units 8,000 10,000 9,000 Ratio of inventory to future sales 25% 25% 25% Budgeted ending inventory units 2,000 2,500 2,250 Add budgeted sales units 6,000 8,000 10,000 Required available merchandise 8,000 10,500 12,250 Deduct beginning inventory units -5,000 -2.000 -2,500 Units to be purchased 3,000 8,500 9,750 Budgeted cost per unit $30 $30 $30 Budgeted merchandise purchases $90.000 $255.000 $292.500 N Cash collections Receivables at 12/31/2019 January credit sales February credit sales Total cash from credit customers Cash Sales Total cash received 315,000 67,500 382,500 Cash Payments for Merchandi January, February, and March 2 C. January Credit purchases $90,000 Accts payable at 12/31/19 72,000 January purchases February purchases Total paid on purchases 72,000 Selling Expense Budgets January, February, and March 2020 d. January February March Budgeted sales $270,000 $360,000 $450,000 Sales commission percent 20% 20% 20% Sales commissions expense 54,000 72,000 90,000 Sales salaries 7,500 7,500 7,500 Total budgeted selling expenses $61,500 $79,500 $97,500


